For those of us who work in R&D&I in food, the international reference events in the food sector, such as Alimentaria and Hostelco are very interesting. With 4.500 exhibitors from 70 countries and nearly of 150.000 registered experts, Spain has once again turned into the European benchmark of this sector. With a great success of attendance and internationalization, this meeting is not only a good opportunity to generate business, but new trends and bets have been presented for the next years in innovation, gastronomy and restoration.
From the point of view of innovation, we must go through Innoval, where 300 new products and new launches were gathering. For researchers, to find products on the market in which they have been worked on in laboratory is satisfactory. In the case of CARTIF, this year some of our clients were present, such as Cecinas Pablo, with its new range of snacks from beef jerky or Campofrío, with their cured hams with 25% less of salt, the result of a project carried out jointly.
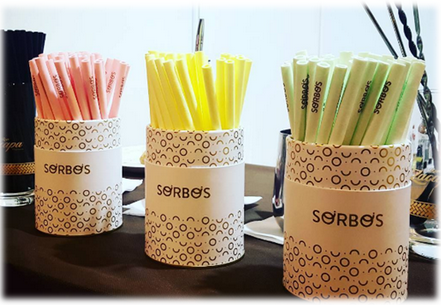
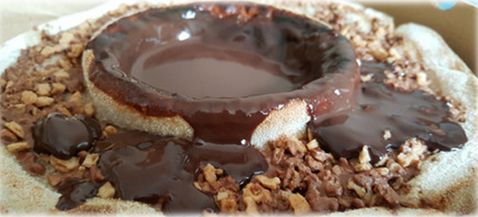
Among the most curious and fun products, the gin-tonic croquettes of Maheso, ready-to-eat calamari sandwich of Pescanova, preserved fish with aloe vera of Vixvital, 3D printed sponge cake of Dulcesol, chocolate pizza of Telepizza, endible straws of Sorbos or the plastic wine glass of One Glass Wine. All of them reflect the importance of R&D&I applied to food to achieve different products that satisfy an increasingly demanding consumer audience.
But, in addition to the most striking and original offers, this edition of Alimentaria has confirmed the trend of recent years: companies seek to offer healthier products, with the reduction of fats, sugars and salt. Pre-cooked dishes, sauces, dairy products, cereal drinks, yoghurts, ‘bio’, ‘with’ and ‘without’ smoothies, sliced for vegetarians (0% meat) or new formulations that include those commonly called ‘superfoods’ (chia, chlorella, spirulina, kale, lucuma, maca…). To this tendency joins the great variety of snacks (meat, vegetables, fruits, legumes or nougat) that are being introduced to the market very quicly.
On the other hand, in the several conferences in the framework of Alimentaria, experiences have been shared in national and international projects, where experts have emphasised the variety of lines of actuation and the strong collaboration between companies and technological centres. This edition underlines the effort of the companies in the development of new products, on the right track of improving their nutritional profiles in their formulations.
The concern of consumers about health in relation to food makes it essential to work on the performance of intervention studies and the preparation of nutritional tests on personalized nutrition in order to establish a diet and health relation focused on the three different large population groups: children, adults and the elderly.
Within this field, in CARTIF we are taking part in large projects such as PRIMICIA, METASIN, PROGRESO or NUTRIPECISIÓN. In all of them, we work to improve the products and adapt the processing conditions to the new formulations in order to satisfy the current regulations and, of course, the needs and requirements set by the consumers.
Food is a trending topic. It is known that a good diet is that which nutrients and food are properly combined, which allows a good state of health.
However, disorders in the diet are currently a real challenge for public health. The growing figures of obesity and diseases related to food in Spain and the rest of Europe, have promoted public administrations related to nutrition and health, develop agreements with the food industry.
Food and Beverage Industry, the first industrial sector of our country, with a turnover of more than 98 M € and with important growth expectations, is now facing new paradigms and challenges in food policy and nutrition.
Thus, new consumer demands and trends in health have promoted the generation of a strategy to improve the composition of food and beverages by the Spanish Ministry of Health through the Spanish Agency of Consumption, Food Security and Nutrition (AECOSAN) with the voluntary commitment of more than twenty sectorial organizations representing 500 companies of the food and beverages sector.
The so-called Collaboration plan for improving the composition of food and beverages and other measures 2017-2020, is aligned with the policy of reformulation promoted by the European Union through several frameworks created within the High Level Group on nutrition and physical activity with Member States, in which food groups and priority sectors were established.
The PLAN includes the reformulation commitments of the Manufacturing and Distribution sectors for more than 3,500 foods and drinks of habitual consumption in children, young people and families in relation to the reduction of added sugars, salt and saturated fats.
Food reformulation consists of improving the content of certain nutrients selected from food without this leading to an increase in energy content or other nutrients, maintaining food safety, flavor and texture so that the product continues to be accepted by consumers. Therefore, this entail a significant investment.
The most noteworthy commitments are, among others, the following measures that will be carried out on 13 food groups in a maximum period of 3 years:
Reduction of added sugars up to 18% in sauces such as ketchup and fried tomato, 10% in dairy products, soft drinks, meat products, breakfast cereals for children and fruit nectars and 5 % in pastries and cakes, cookies, ice cream and special breads
Reduction of saltup to16% in meat products and sauces, up to 13,8% in salty snacks, 10% for ready-to-eat meals and 6,7% in vegetable creams.
Reduction of saturated fats; 10% in the case of for ready-to-eat meals and salty snacks and 5% in pastries, cakes and cookies
This voluntary commitment of the Food Industry to the reformulation of certain foods has been associated with an important effort on innovation for the identification of new raw materials and ingredients, reformulationand production processes in order to achieve food according to sensory specifications and quality that consumers expect, topics in which we have worked intensively in CARTIF with a large number of companies in the sector.
This PLAN also includes agreements with sectors such catering or retail industry, with which commitments have been made to increase the offer healthier menus and meals, with an increase in the offer of dishes that include vegetables, greater presence of lean meats and fish accompanied by garnishes of vegetables, vegetables and/or legumes and to minimize the offer of fried precooked dishes. Meals will be prepared with griddled, baking and oven and sauces or stir-fry dressings will be avoided. Olive oil will be promoted as the best dressing option. Bread will be whole grain and the main dessert option will be seasonal fruit.
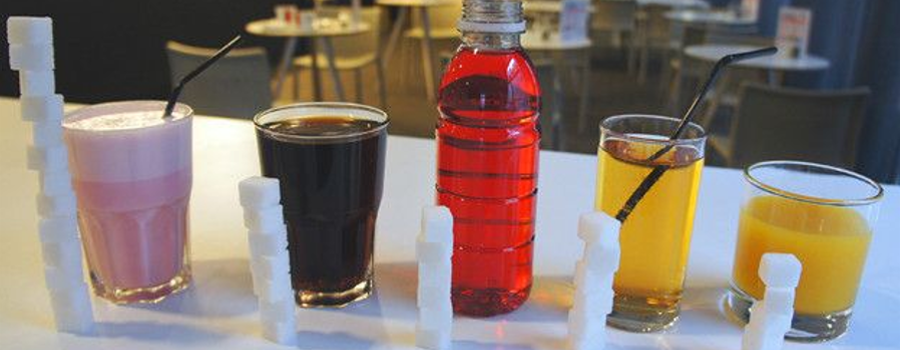
Regarding the Modern Restoration or HORECA sector, commitments have been made related to the reduction of the amount of sugar contained in single-dose sachets to 50 % and 33 % in those of salt, as well as the use of low-fat milk in breakfast services.
Finally, vending or automatic distribution sector commits to reduce the maximum amount of sugar added in hot beverages and to increase the number of balanced foods, water and soft drinks without added sugars of the total of products and beverages included in the machine.
With this PLAN, is intended that the different sectors work synergistically to contribute to a more balanced diet with high nutritional quality. The PLAN also wants to promote R & D aimed at creating healthier products, strengthen the collaboration of companies and promote the coordination of these measures with the administrations, as well as impact, from the health and social point of view, the shopping basket and promote good practices to improve the diet from the nutritional point of view. Through all these measures, it is also intended to contribute to improving the scientific base and collect data that drives these initiatives and their monitoring at European level.
These actions, undoubtedly, represent an advance and we will find food products with a composition, in certain nutrients, improved compared to the current ones. However, it is necessary to continue taking steps on behalf of all the actors involved in promoting health and reducing the appearance of food-related diseases by creating new strategies.
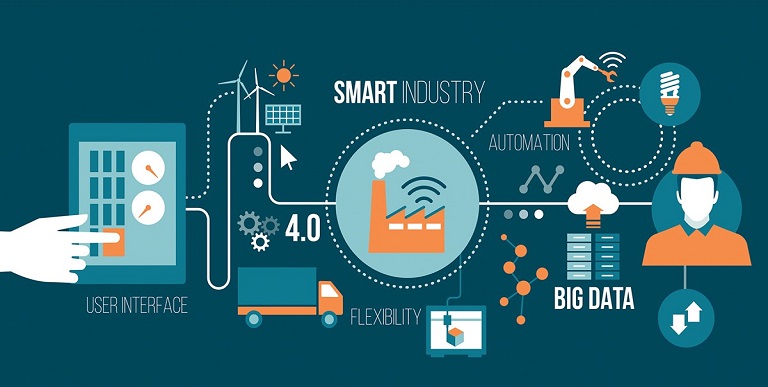
Big Data as one of the so called “digital enablers” of Industry 4.0 sits at the core of promising technologies to contribute to the revolution at factories where vast amounts of data (whether they are big or small) hides enormous amount of knowledge and potential improvements for the manufacturing processes.
The Strategic Research and Innovation Agenda (SRIA) of Big Data Value Association (BDVA) defines the overall goals, main technical and non-technical priorities, and a research and innovation roadmap for the European Public Private Partnership (PPP) on big data. Within the current expectations of the future Data Market in Europe (around 60 B€), Manufacturing was at the first place in 2016 (12.8 B€) and in the 2020 projections (17.3 B€), revealing a leading role played by this sector in the overall Data Economy.
With the aim to find an agreed synthesis, the BDVA adopted the “Smart Manufacturing Industry” concept definition (SMI), including the whole value chain gravitating around goods production, secondly identified three main Grand Scenarios aiming at representing all the different features of a SMI in Europe: Smart Factory, Smart Supply Chain and Smart Product Lifecycle.
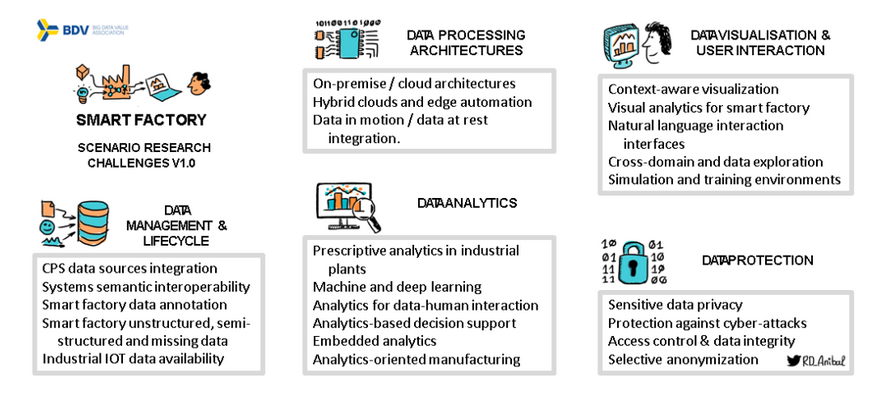
To contextualize these research challenges, the BDVA association has defined five technical areas for research and innovation within the BDVA community:
Data Managementand lifecycle motivated by the data explosion, where traditional means for data storage and data management are no longer able to cope with the size and speed of data delivered.
Data Processing Architectures originated by fast development and adoption of Internet of Things (IoT) and the need to process immense amounts of sensor data streams.
Data Analytics that aims to progress technologies and develop capabilities to turn Big Data into value, but also to make those approaches accessible to wider public.
Data Protection addressing the need to ensure the correct use of the information whilst guarantying user privacy. It includes advanced data protection, privacy and anonymization technologies.
Data Visualisation and User Interaction addressing the need for advanced means of visualization and user interaction capable to handle continuously increasing complexity and size of data and support the user exploring and understanding Big Data effectively.
During a series of workshops activities, started from the 2016 EBDVF Valencia Summit till the 2017 EBDVF Versailles Summit, BDVA experts distilled a set of research challenges for the three grand scenarios of smart manufacturing. These research challenges where mapped in the five technical priority areas of the big data reference model previously introduced.
To exemplify the outcomes of this mapping, the following figure gathers the headings of the set of challenges identified and discussed by the BDVA members into the Smart Factory Scenario. The interested readers are encouraged to analyze the full set of challenges in the SMI white paper.
Challenges set initially in this first version of SMI position paper set the tone for the upcoming research needs in different Big Data areas related with manufacturing. In the Smart Factory scenario the focus is on integration of multiples sources of data coming not only from the shop floor but also from the offices, traditionally separated in Industry 3.0. Interoperability of existing information systems and the challenge of integrating disruptive IoT technologies are major trials in the area of data management. Closer to the needs of a Smart Factory, the analytics challenges are focused on prescriptive analytics as tools for an optimal decision making process at the manufacturing operations management site including the optimization trough the evolved concept of digital twin.
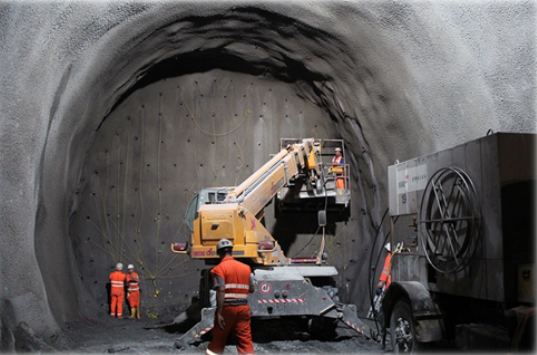
Ensuring the safety of workers inside confined spaces is a critical activity in the field of construction and maintenance because of the high risk involved in working in such environments. Perhaps it would be useful, first of all, to know what is meant by confined spaces. There are two main types of confined spaces: the so-called ‘open’ ones, which are those with an opening in their upper part and of such a depth that it makes their natural ventilation difficult (vehicle lubrication pits, wells, open tanks, tanks),…) and ‘closed’ ones with access openings (storage tanks, underground transformer rooms, tunnels, sewers, service galleries, ship holds, underground manholes, transport tanks, etc.). Workers entering these confined spaces are exposed too much greater risks than in other areas of construction or maintenance and it is therefore essential to apply extreme caution.
Each confined space has specific characteristics (type of construction, length, diameter, installations, etc.) and specific associated risks, which means that they require solutions that are highly geared to their specific safety needs.
The ‘conventional’ risks specific to confined spaces are mainly oxygen suffocation, inhalation poisoning of pollutants and fires and explosions. But new ’emerging’ risks from exposure to new building materials such as nanoparticles and ultrafine particles are also emerging. In addition, as research into new materials improves, there is also a better understanding of their potential negative effects on human health and how to prevent them.
The truth is that the training of workers and current safety regulations seek to anticipate risk situations before they occur in order to avoid them and thus prevent the appearance of accidents. But several problems arise: on the one hand, the regulations are not always strictly observed (whether due to workload, carelessness, fatigue, etc.) and on the other hand, there are always inevitable risks. In the case of carelessness, systems can be proposed to minimise this type of error and in the case of risks that cannot be avoided, systems can be proposed to detect them early and plan the corresponding action protocols.
It should be noted that risk situations do not usually appear suddenly and in most cases are detectable in time to avoid personal misfortunes. There are several problems: the detection of these risks is usually done with specific measurements using the portable equipment that the workers must carry, many times the workers are not controlled to access the premises with the corresponding protection equipmente and almost never a continuous monitoring of the indoor atmosphere is done.
In recent years, new technologies and equipment have been developed that can be applied to improve security in this type of environment and reduce the associated risks.
In this type of environment, an effective risk prevention system should be based on technological solutions capable of providing answers to safety aspects throughout the entire work cycle in confined spaces: Before entering the space itself, during all work inside the enclosure and when leaving the work space (whether it is at the end of normal work or by evacuation).
The latest confined space air quality monitoring systems are based on multisensorial technology that combine different detection systems to ensure the best possible conditions to avoid or reduce the risks present in the confined spaces.
Advanced data processing techniques (machine learning, data mining, predictive algorithms) are also being applied, enabling much more efficient and rapid information extraction.
In the same way, great advances have been made in access control and personnel tracking systems, allowing us to know the position of each worker and even his or her vital signs in order to detect almost immediately any problem that may arise.
Finally, it should be noted that the use of robots and autonomous vehicles (land and air) equipped with different types of sensorization are increasingly being used to determine the conditions of a site before it is accessed. This is especially useful in those where there may have been an incident: power failure, collapse, fire,… or simply because environmental conditions are suspected to have changed and the reason is unknown.
CARTIF has been working on these issues for many years now, both in safety projects in critical construction environments (PRECOIL, SORTI) and in specific systems for tunnels and underground works (PREFEX, INFIT, SITEER).
In short, the development and implementation of new specific technologies can help to save lives in such a critical environment as confined spaces.
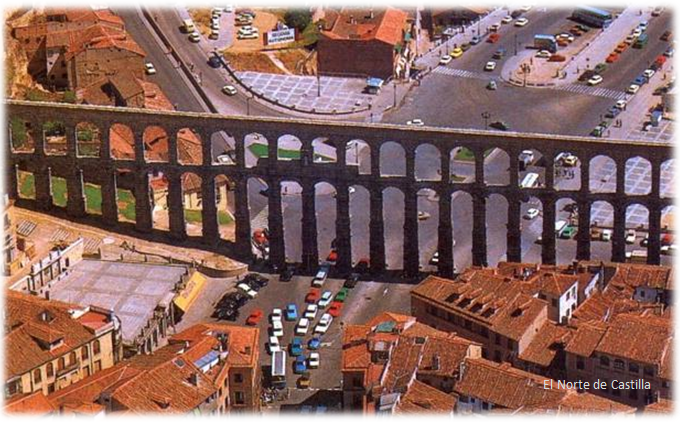
In two previous blogs of ‘When the Historic Buildings Talk’ (2)and(3), we have described how does affect and what is the importance of monitoring temperature and humidity as well as lighting (natural and artificial) in historic buildings. To complete this saga of pernicious aspects, the turn to the pollutants is open just now.
We all know, and suffer, that the composition of the air is altered by compounds that come mainly from the use of fuels (road traffic and heating) and industrial activities. These pollutants can trigger chemical reactions in the materials that make up the cultural assets (movable or immovable), degrading them to a greater or lesser extent. The pollutants with the highest concentration in the exterior are sulphur dioxide (SO2), oxides of nitrogen (NOX), ozone (O3) and suspended particles (PM). In addition to these pollutants that “travel free” throughout the air outside the buildings, there are others to be taken into account inside them, such as vapors of organic compounds (COV), products used in conservation and restoration tasks, and even human presence.
Again, we have to ask ourselves: what are their effects? Here it is a short description of the main ones:
SO2 is related to coal combustion and to industrial activities and transportation. It causes metal corrosion, pigment discoloration, weakening of leather and acidification of paper.
Among the NOx, the nitrogen dioxide (NO2) needs to be highlighted. It comes from combustion in vehicles and in industry, and associated effects are the discoloration of pigments and the contribution to the degradation of paper and leather.
The renowned ozone (O3) is naturally present in the stratosphere. This is a good point, because it protects us from malignant solar radiation, but at ground level is linked to road traffic and intense solar radiation. It causes the degradation of natural gums and the discoloration of pigments.
PM are characterized by their diameter, distinguishing between fine particles (PM 2.5: with diameter equal to or less than 2.5 μm), and coarse particles (PM 10: with a diameter between 2.5 μm and 10 μm –keep in mind that 1 μm is one-millionth of a meter-). The fine ones affect the discoloration and dirt of the surfaces. On the other hand, coarse ones contain highly reactive compounds (e.g. residues from incomplete combustion of road traffic). The dust enters this section: apart from its obvious aesthetic impact (denotes sloppiness and lack of care) can lead to chemical deterioration, and can serve as a habitat for insects (do you get bit?…)
In general, the study of outdoors pollution is more developed and legislated than the indoors one. However, in the field of Cultural Heritage, the study of indoor air quality is very important because of the logical conservation demands. Following once again the criteria of the IPCE, which establishes the Spanish National Preventive Conservation Plan (PNCP), these are the evaluation parameters of the risks derived from the pollution to which the historic buildings are exposed:
External parameters:
Medium where the cultural asset is located (rural, urban, industrial, coastal, etc.).
Polluting sources nearby, whether of anthropogenic origin (industrial and transport processes) or of natural origin (volcanoes, fires, sea water, animal life, vegetation, etc.).
Meteorological factors such as winds and precipitations that influence the dispersion and deposition of pollutants.
Internal parameters:
Sources of indoor pollution.
Quality of the external air and location of the asset in relation to the exterior.
Waterproofing of the building, its compartments and furniture.
Distribution of pollutants by air circulation.
Already existing air conditioning, heating and ventilation facilities, as well as their use and maintenance.
And, these are the criteria that must be taken into account for the assessment of the deterioration produced by the pollutants:
The pollution damage is cumulative, so very low limits needs to be set depending on the detection ability of available devices.
The damage is determined by the dose, i.e. the concentration of the contaminant (in μg/m3 or parts per billion -pbb-) by the exposure time. This exposure time is conveniently estimated to take into account the overall effect.
Keep in mind the mutual influence between pollution and other already known factors, such as humidity and lighting.
In conclusion, the air quality inside and / or outside the built heritage defines its conservation (see Figure). Let me remind you again that CARTIF is ready to advise you, to help you and to offer solutions tailored to your needs. You can have a look to some projects: RESCATAME, SHCITY and EQUINOX. We have been innovating in Natural and Cultural Heritage for more than 20 years. At your disposal!
There are many research and innovation projects whose objective is the design and development of an electronic device, whose purpose is to satisfy main requirements of the market. In general, we look for devices with the necessary capacity to acquire information about the physical world that surrounds us and, in many cases, interact with it.
To carry out the validation of the idea, it is necessary to carry out a previous prototype that allows a first approximation of the final solution. Generally, the most complex and interesting part is the electronic design of the device. In this part, the design and development of the electronic board is carried out, defining consumption and communication requirements, selecting microcontrollers, PCB board, components, connectors, etc.
This task means to have expensive electronic design software licenses, to integrate expert electronic staff into the work team and to allocate a significant part of the project hours to its execution.
Times change, more and more hardware development platforms are involved in making these changes possible. These platforms offer the user a board that integrates the microcontroller with the circuits and basic components of communication, power, etc. Among them stand out: Parallax, STMicroelectonics, LaunchPad, Microchip ChipKIT, mbed (version of ARM to give solutions to “internet of things”).
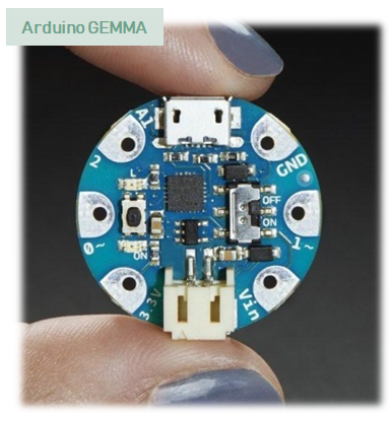
But, if I had to choose one of these platforms at this time, I would do it for Arduino. I think he has cleverlycombined the hardware and software, generating a flexible prototyping platform, open source and easy to use, whose features are:
A hardware based on powerful boards that integrate simple microcontrollers. Its main characteristics are low cost, small size and low consumption. It is published under a Creative Commons license, a wide variety of auxiliary equipment developed by other manufacturers that support this platform is available on the market.
Open source software, based on a simple and clear development environment. That allows expert programmers to generate complex solutions. In part, this must availability of a multitude of standardized libraries contributed by a large community on the internet.
These characteristics facilitate and guarantee the integration of the new trends and evolutions that are continuously generated in the field of electronics, thus improving their features and capabilities.
Although a priori it may be thought that this platform is designed to start experimenting with electronics, its features make it a flexible and powerful tool for expert users, facilitating the development of advanced prototypes.
Therefore, these tools allow to reduce costs and design times of any technological proposal, facilitating the creation of prototypes and reducing the errors generated in its development phase. This allows the researcher to forget about the implementation at a low level and focus on the design features.
This technology has great potential for integration in several of the technological research and innovation lines with which the European Union is currently working, such as, the Internet of Things and in Factories of the future, of H2020.
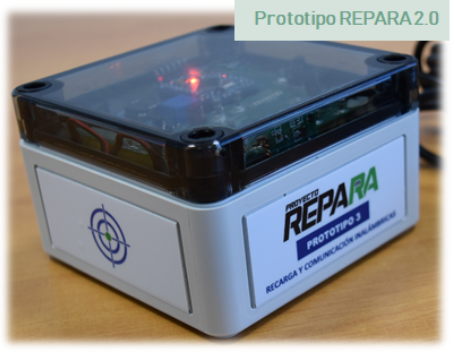
In CARTIF we are aware of its importance and we have started to use these platforms as support in the development of our research work. A sample of this is the European project “SANDS”, where the Internet of Things, Social Networks and Intelligent Systems converge, and the Spanish project “REPARA 2.0”, in which new autonomous and wireless sensors are searched to be embedded in the asphalt layer of our roads.


