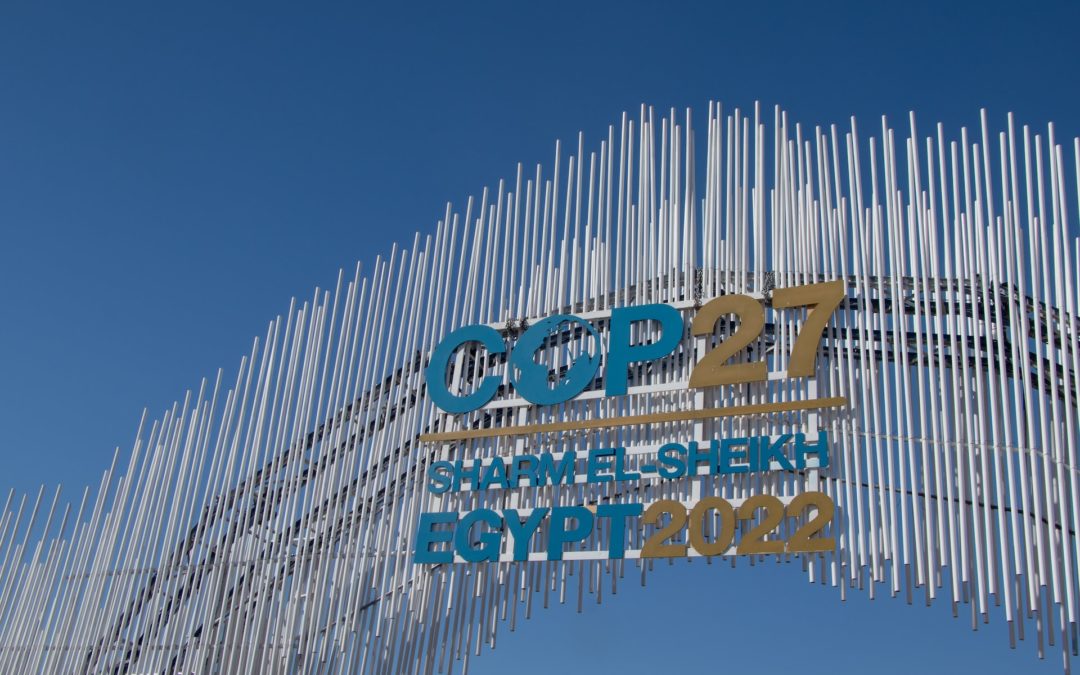
From November 6 to 20, the 27th Conference of the Parties took place in Sharm el Sheikh, where state leaders met in search of agreements against climate change and the definition of an action plan to deal with the challenges current. In this blog we reveal the conclusions about this conference and why this topic should interest you.
Climate change…I´ve heard about it, but why should I care?
When we talk about climate change, a large part of the population relates it solely to the increase in temperature. And yes, they are right, the severity of climate change is evaluated through the increase in temperature, but it is the consequences derived from this increase in temperature that should concern us, as well as its causes, in order to combat it. Listed below some relationships that seem somewhat contradictory:
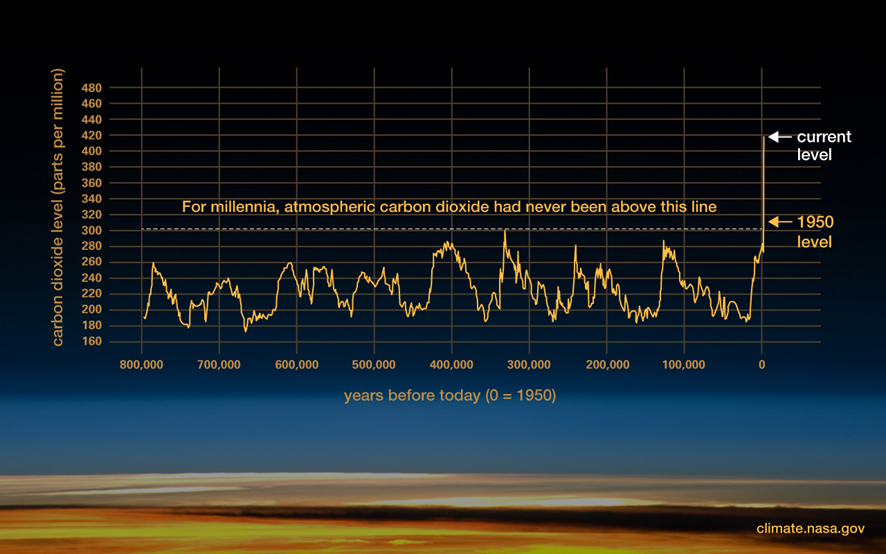
Cyclical changes in the climate have always existed, this is one more: yes and no. For 100 thousand years there have been very considerable climatic changes and in a cyclical way. However, with the arrival of the Holocene, 10,000 years ago, the temperature on Earth stabilized, only varying its average temperature within a range of one degree Celsius. This facilitated the development of a stable and predictable planet. It is, in fact, the only period in which we can ensure that the development of human life can take place. However, human activities and the consequent increase in greenhouse gases in the atmosphere have made us leave the Holocene, entering the Anthropocene, an unprecedented situation, as can be seen in the graph below.
https://climate.nasa.gov/evidence/
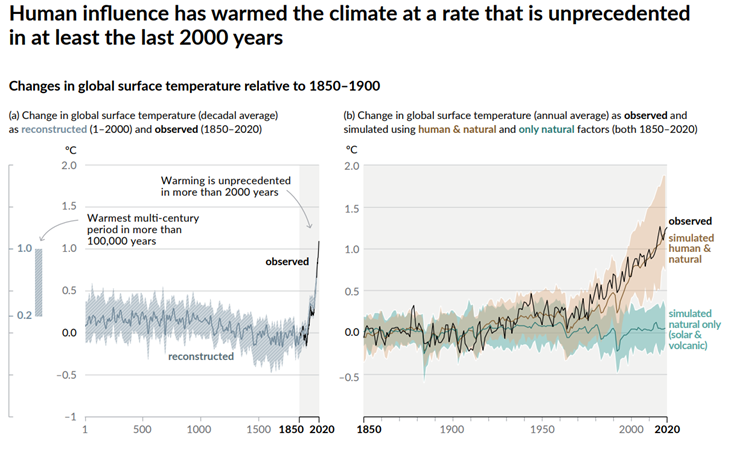
This time is characterized by an exponential increase in temperatures, as you can see in the graph below, extracted from documentation of the Intergovernmental Panel against Climate Change (IPCC).
Valérie Masson-Delmotte et al., “Climate Change 2021: The Physical Science Basis,”
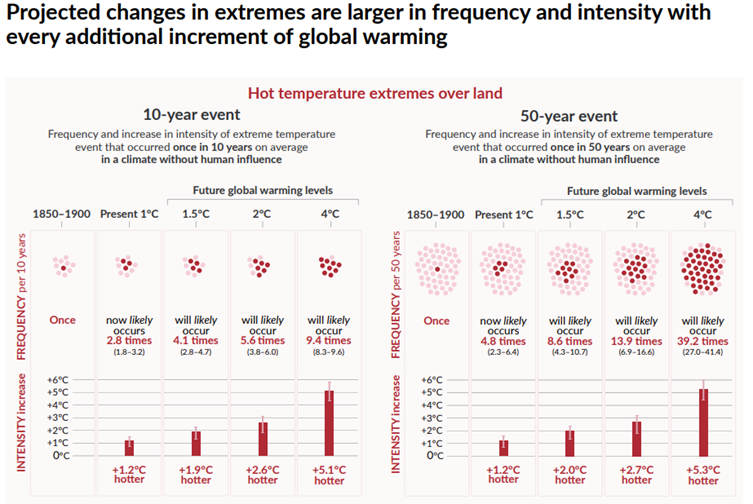
The temperature rises, but it is colder in winter: the entry into the Anthropocene and the rise in temperatures have meant that we are at risk of completely destabilizing the Earth’s atmospheric processes and breaking their balance. It is precisely this imbalance that causes more extremes in temperatures, both in winter and summer. The graph shows the frequency of extreme events that would exist depending on potential future temperature increases.
It rains more, but there are more droughts: an increase in the Earth’s temperature also affects the temperature of the oceans. Since warm water occupies more, this carries a risk for all coastal areas that could be affected by the rise in sea level, and also has an impact on the progressive melting of the poles (whose decrease in surface area also reduces the capacity of the Earth to reflect solar radiation). However, what is not so immediate is the alteration of the water cycle: as there is more water vapor in the environment, more intense storms are produced. This can lead to heavy and frequent flooding, as well as the occurrence of hurricanes. In fact, events like Hurricane Sandy in 2012 are estimated to occur annually starting in 21001. But what about droughts? When there is an increase in temperature, a greater amount of water evaporates from the soil (again contributing to the destabilization of the water cycle). When it returns in the form of intense rains to the ground, the ground is not capable of absorbing this amount of water at this speed, which contributes to floods derived from these intense precipitations. In addition, due to other types of processes, the absorption capacity and quality of the soil is currently reduced This has several consequences, such as the lack of food security. To learn more about this topic, I recommend this documentary: “Kiss the Ground”.
Therefore, the problem of climate change is not only the increase in temperature, but also all the consequences derived from it and the imbalance that it implies in the ecosystemic services the Earth provides. For all these reasons, the temperature limit is set at 1.5ºC, which is what allows it to operate in a safe environment. However, it seems easy to overstep it.
And what has been decided at COP27? Are the agreements that have been made enough?
Currently, we are not doing enough reduce GHG emissions and stay within the limit of 1.5ºC of temperature increase. Although there are different opinions about the results of COP27, a fairly general feeling is that, although the 1.5ºC target set in the Paris Agreement and renewed at COP26 in Glasgow has been maintained, much more needs to be done. In particular, the countries that emit the most have not committed to eliminate fossil fuels, nor to establish new agreements to contribute to the mitigation of climate change2.
However, a positive point of COP27 is its support for the most vulnerable countries, focusing the discourse on climate justice. Indeed, the harshest consequences of climate change end up being suffered by those countries that contribute the least to it and are more vulnerable. In fact, according to the 2018 Lancet Countdown Report, it is estimated that there could be one billion climate migrants.
Every tenth of a degree counts. The consequences of not acting and even temporarily exceeding this limit of 1.5ºC can lead to severe risks, some of which may be irreversible, according to the latest IPCC report. Globally and in a coordinated way, we have to adapt to these new circumstances, but also mitigate the future consequences of climate change. However, these mitigation and adaptation actions can only be applied at the local level. To give you some ideas of what can be done, I recommend a project we are working on at CARTIF, as well as provide additional references.
How does CARTIF contribute to the fight against climate change?
At CARTIF, especially from the Energy and Climate Policies area, we work on the development of models (at different scales), tools and solutions to analyze climate change and propose adaptation and mitigation solutions. In particular, in the RethinkAction project (GA 101037104) coordinated by CARTIF, we will develop an integrated evaluation platform to simulate and evaluate adaptation and mitigation solutions based on land uses. This analysis will be carried out both at a local, European and global level, as well as over time, which will allow both the general public and those in charge of making decisions to better understand the impact of its application. To do this, we will develop system dynamics models that we will apply both in the 6 case studies (representative examples of the impacts of climate change), and at a European and global level, and we will rely on georeferenced satellite information.
If you want more information…
I propose the consultation of three sources.
1. First of all, the most relevant documentation is that generated by the United Nations Intergovernmental Panel on Climate Change (IPCC), where reports are periodically generated to assess the climate change situation, focusing on various areas. In particular in the latest report they focus on the impacts of climate change, adaptation and vulnerability.
2. Secondly, I suggest the simulator of the EN-ROADS tool, developed by CLIMATE INTERACTIVE and MIT to analyse future scenarios and the consequences on temperature depending on the policies applied in various fields such as energy, transport, etc. .
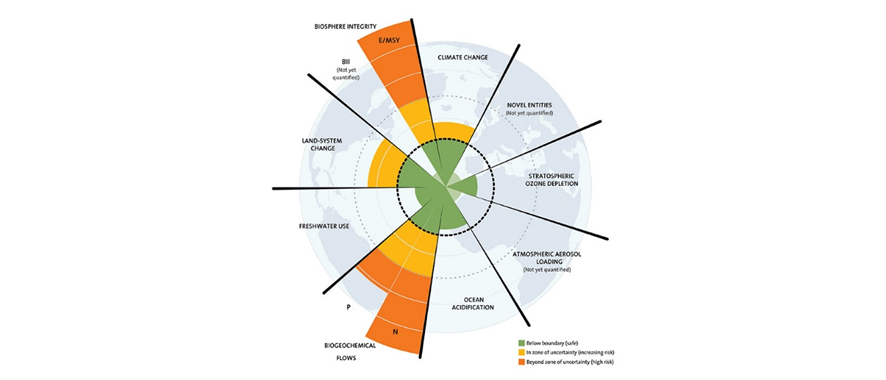
3. Finally, it is worth highlighting the work of the Stockholm Resilience Center and the research orchestrated by Johan Rockström. These experts have analysed certain limits (planetary limits) in a series of areas that should be respected (see image below). They are points of no return where, once passed, we could not go back and they would cause the functioning of the earth to get out of control. As can be seen, many of them are related to climate change, but also to the pollution we generate, the use of water, etc.
In addition to being able to consult the scientific articles where this theory is exposed (here I leave an article), I recommend viewing the documentary that they have made about it, called “Breaking boundaries: The Science of Our Planet”. According to the documentary, the main message is hopeful: we still have time. It also highlights four main lines of action:
Reduce greenhouse gas emissions to zero
Protect all those terrestrial elements that contribute to absorbing our impacts (wetlands, soils, forests and oceans)
Change our diets and the way we produce food
Move towards a circular economy.
While many decisions should be made at a higher policy level, how can you use your voice, your vote, and your choices to contribute to this fight?
Your world depends on it.
1 Georgina Gustin, “U.S. Coastal Cities Will Flood More Often and More Severely, Study Warns,” Inside Climate News, June 7, 2017. https://insideclimatenews.org/news/07062017/coastal-flooding-extreme-sea-level-rise-forecast
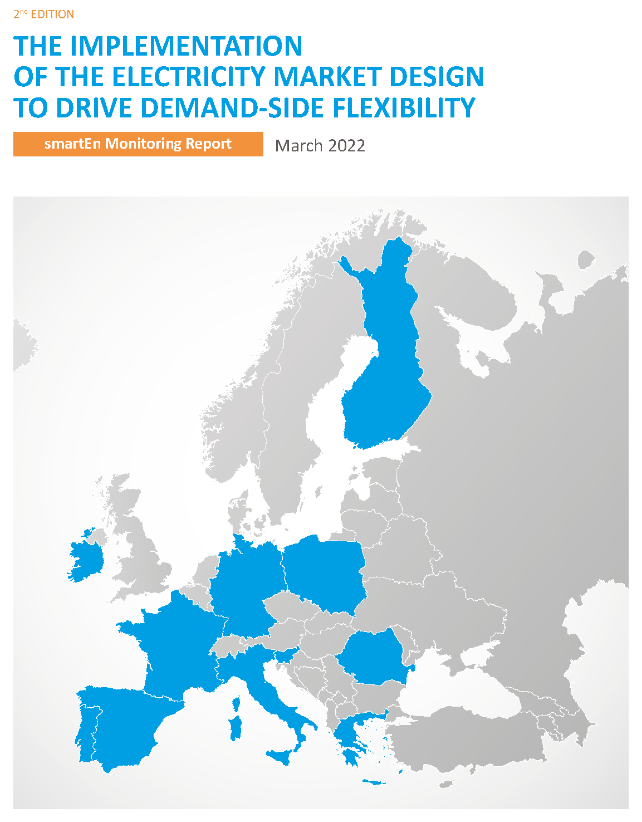
A few weeks ago, SmartEn1 association published an estimate of the benefits that could be achieved through flexible demand management. Recall that flexible demand management is the set of actions that stimulate consumers to change their usual pattern of electricity consumption in response to some kind of request.
It is considered that demand flexibility management will be one of the pillars to achieve the complete decarbonisation of the energy system. As the weight of classic generation systems, based on fossil fuels, decreases, it will become more difficult to match production with demand, since renewable energies are not controllable. This problem can be solved by storing energy in some way, such as hydrogen generation, heating water and using batteries. But, in addition to storage, attempts can be made to shift demand to coincide with times when renewable generation is most abundant. If demand is flexible, this could be done without prejudice to the consumer.
Let´s go back to the SmartEn report. They have used electricity market models and estimates of consumption and generation for 2030 published by the European Union and have come to some interesting conclusions. The first is that in 2030 there will be 164 GW of flexible power available in Europe to ramp up (consume less in the case of demand, generate more in the case of generation) and 130 GW of flexible power to ramp down. In terms of energy this is 397 TWh and 340.5 TWh respectively. To put these figures in perspective, all the nuclear power plants in Spain typically produce around 60 TWh per year, or that Europe’s electricity demand in 2021 was 3,399 TWh per year, or that Europe’s electricity demand in 2021 was 3,399 TWh2 per year.
Exploiting demand flexibility will reduce the price of electricity because it can be managed to increase the use of renewable energy. The report estimates that these savings could amount to 4.6 billion euros. The increase in the use of renewables would occur because up to 15.5 TWh of renewable energy would not be wasted and would not have to be “thrown away” because the system, thanks to flexible demand management, will be able to consume them when they are available.
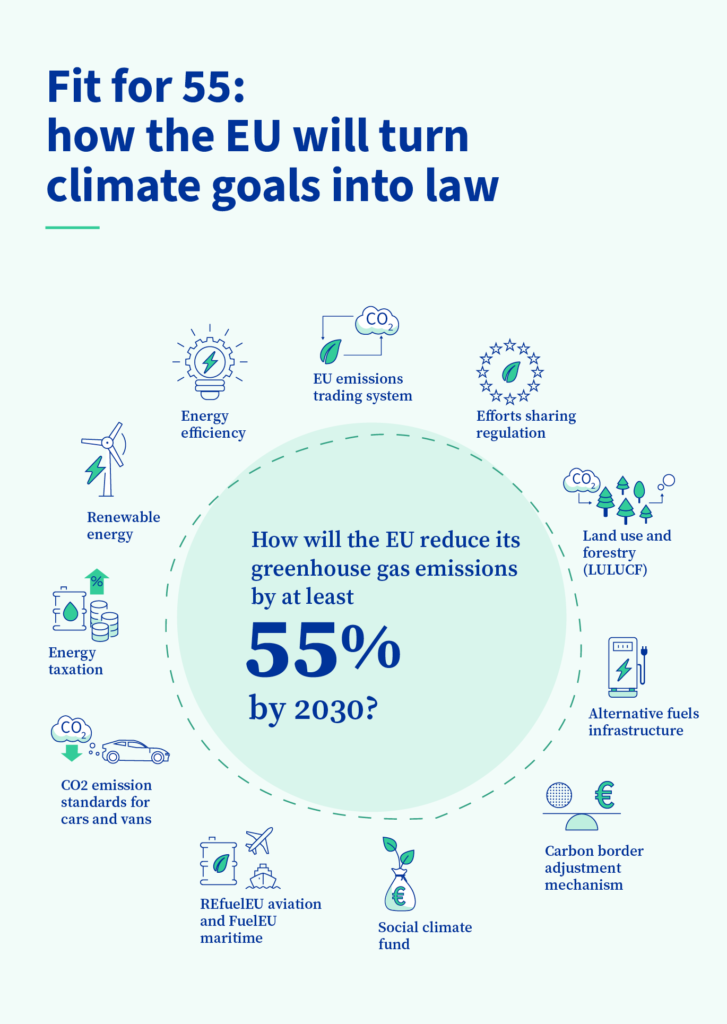
If we take into account that the trigger for the whole transformation we are undergoing is the fight against climate change, the report estimates that flexible demand management could lead to 37.5 million tonnes less greenhouse gas emissions than if demand flexibility were not used. This would represent 8% of total emissions and would allow the power generation sector to exceed Target 553, i.e. to have reduced GHG emissions by 55% by 2030 compared to 1990 emissions.
The energy transition could threaten security of supply, i.e. the everyday gesture of flicking a switch and the light coming on could no longer be so commonplace. The report picks up on this threat and says that by 2030 Europe will have a generation capacity shortfall of 60 GW. Solving this problem by building generating plants could cost around 2.7 billion euros, an investment that could be avoided if 60 GW of flexible demand were made available. Related to security of supply are balancing markets, where energy is sold to avoid problems in the stability of network. If these markets were given access to flexible demand management, SmartEn estimates that the price of energy in these markets could be reduced by 43% to 66%, which would ultimately benefit consumers. The distribution grid may also face problems in ensuring its proper functioning when the presence of distributed renewable generation gains the expected weight. To solve these problems, it would be necessary to invest between 11.1 and 29.1 billion euros less than expected if flexible demand were to be managed correctly.
The end consumer would also benefit from flexible demand management, not only if they have loads that are flexible, such as electrified air conditioning or electric vehicle charging, to name two, but they will also have to pay less in terms of grid usage tolls. SamrtEn`s report estimates that these terms would result in direct cost reductions for consumers of up to 64% per year, some 71 billion euros in total. It would also benefit from indirect cost resuctions due to lower energy prices, reduced investment in the distribution network to keep it up to date and reduced costs associated with greenhouse gas emissions. The report estimates that this indirect reduction would be around €300 billion.
From the SmartEn report it seems that there would be nothing but benefits if flexible demand is managed correctly. So is flexibility already being exploited for the benefit of the energy system, consumers and the environment? The answer depends on the country, but in general, progress is slow. In the case of Spain, steps have been taken to define the role of the independent aggregator in the management of flexibility, but the necessary regulation has not been developed and, therefore, there are still no business models that can attract any type of consumer. The association Entra Aggregation and Flexibility has just presented a roadmap for demand flexibility according to which independent aggregators and market adaptation will be ready by the end of 2023. A plan that seems very ambitious considering the delays that have been dragging on, but which, if fulfilled, would represent a great step forward in achieving the decarbonisation objectives sought by both the Spanish government and the European Union.
Also in Spain we find an opportunity for flexible demand participation through balancing markets, where very large consumers can obtain economic benefits thanks to their flexibility. In addition to this, the first auction has recently been held. Consumers with flexibility have committed to reduce their demand by the amount they have bid when rewuired to do so by the system operator, for which they will receive a remuneration of 69.97€/MW. The bad news is that only 497MW have been allocated.
Demand-side flexibility management is set to be an important element in the new energy system. It can be achieved through voluntary and remunerated mechanisms as long as consumers adapt quickly enough and regulation is favourable. If this is not achieved, we will learn to be flexible by imposing restrictions on consumption.
The COVID-19 hangover has left us with a supply crisis with long queues (not only at the supermarket) that has increased the prices of equipment and all kinds of components. In addition, the armed conflict between Russia and Ukraine has led to an energy crisis with gas prices rising steadily.
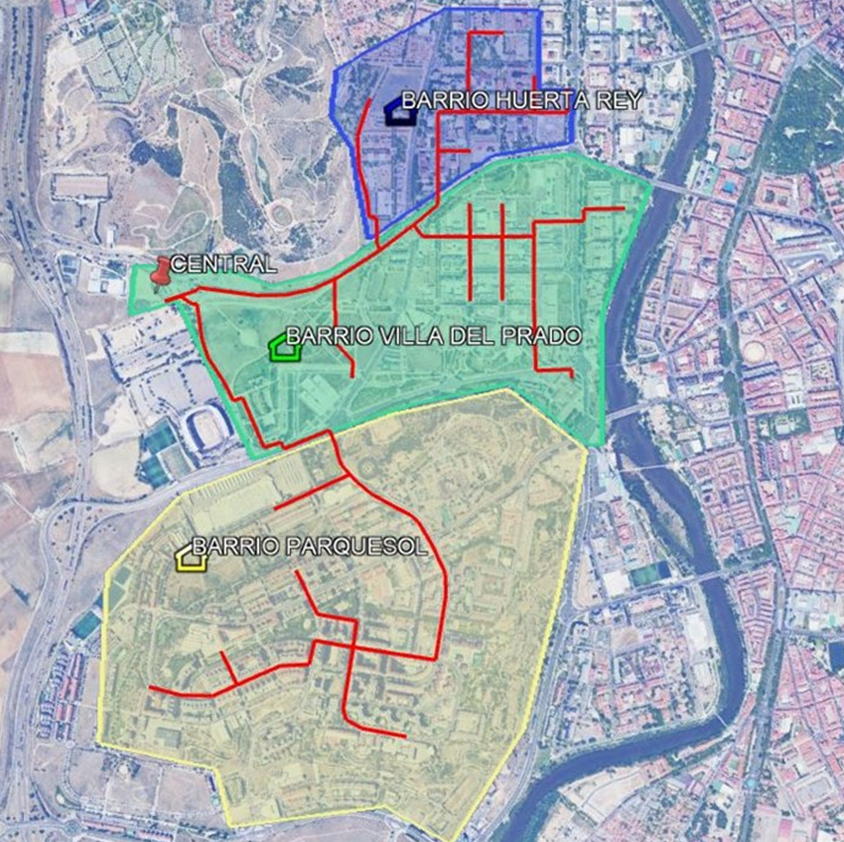
Faced with this uncertainty and the growing fear of being cold in winter, some neighbourhood communities have started to connect to district heating networks (or heat networks). In Aranda, for example, 1950 homes will be connected to a biomass thermal network. The same is happening in Valladolid, where new heat networks are being installed in the neighbourhoods of Huerta del Rey, Parquesol and Villa del Prado. In other neighbourhoods, according to RTVE, residents’ associations are deciding to turn off central heating in response to rising prices, which could lead to an increase in the number of people living in energy poverty. In this context, the latter would mean people staying cold in their homes for fear of a high energy bill.
But, what are heat networks?
Heat networks or district heating networks are heat (or cold) production facilities that supply energy to each dwelling through underground pipes. Among the major advantages, compared to individual systems (the usual household boilers), are that heat networks allow the integration of renewable energy sources to increase independence from external fossil fuels, reduce emissions and lower costs for end-users. Other benefits include the removal of individual equipment from indoor spaces, which means more usable space available inside homes, and being able to offer a supply service independent of fossil fuels (and their price rises). Their main disadvantage is that they often require extensive work to prepare for the installation of pipework, traditionally involving the construction of large production plants with tall and aesthetically unattractive chimneys, and are simply not known to the general public, nor the benefits they can provide (especially in the case of Spain).
Then, affect the urban landscape of cities?
The answer is not necessarily. The New European Bauhaus (NEB) initiative aims to improve the quality of life of citizens through the joint promotion of the principles of Beauty, Sustainability and Inclusion in our environment, which is equivalent to good, beautiful and for all.
These principles focus on reconnecting with nature, regaining a sense of belonging and fostering participation, sustainability and circularity. In the case of heat networks, this holistic approach can be achieved in different ways.
As regards the sustainability pillar, the use of renewable energy sources (geothermal, solar thermal, biomass, biogas, recovery of surplus heat from industry) can be increased in thermal networks, as is being done at a general level in the sector to reduce CO2 emissions and other pollutants, but also, for example, through the revaluation of ashes or forestry waste.
As regards the social dimension and inclusion, by integrating more sustainable alternatives and supplying heat or cooling to a large number of households, affordable, secure and flexible heat or cooling supply can be promoted, thus reducing cases of energy poverty. In addition, digitalisation and the combination of networks with energy communities promote citizen participation and inclusion in the energy transition, where they can discuss, give feedback, engage in demand-side management strategies and even encourage users to become prosumers of heat.
But how can heat networks be made beautiful? At CARTIF, we have found that, through the generation of green spaces (such as parks) or multi-purpose spaces, it is possible to make the power plants beautiful spaces integrated into the urban, cultural or educational landscape. In addition, it is possible to reduce the visual impact of heat networks by burying the installations, and thus also the possible social rejection associated with the aesthetic component of these supply networks.
A case study in Heerlen, the Netherlands.
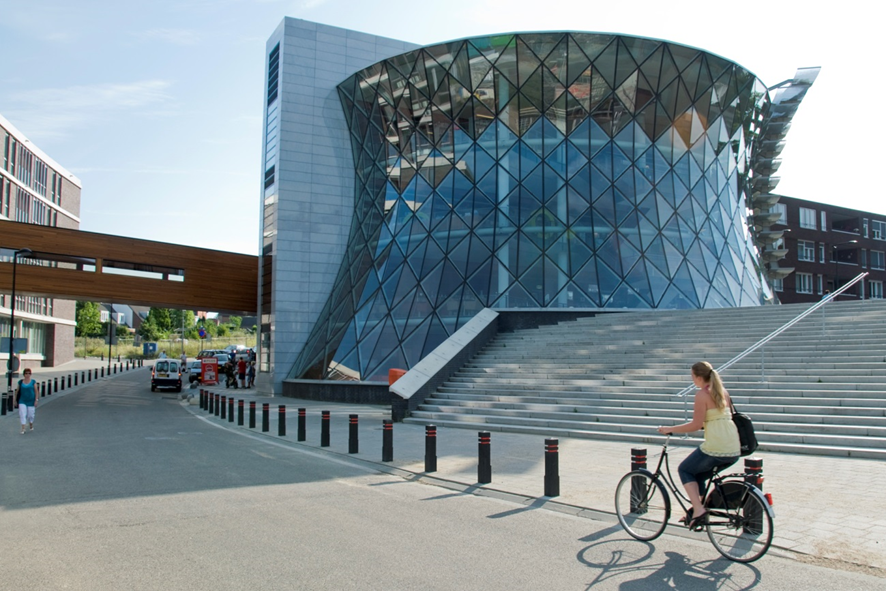
A very illustrative example of the successful application of the New European Bauhaus principles to heat networks is the network in Heerlen (Netherlands), which supplies 350 households with heat and cold thanks to geothermal energy. This network has boreholes at different temperature levels that allow it to provide heat of around 40°C in winter and 16°C of cooling in summer. The installation uses old coal mines as underground thermal storage and also uses surplus heat from a nearby steel industry, which would otherwise be lost to the environment. This could only be promoted in Spain if the houses were first insulated in order to lower the temperature required for heating and thus lower the temperature of the district heating networks. In Heerlen, at each substation each user would have an auxiliary heating system (which could be heat pumps) to meet their thermal demand. Thus, its generation is sustainable and guarantees affordable prices for citizens.
Moreover, the network’s generation plant has a modern and innovative aesthetic that blends in with the urban environment and is part of a multifunctional building that includes a supermarket, a café, a conference room and a library. In this way, far from having a negative visual impact or provoking rejection, it has become an iconic meeting point in the city.
Figure 2. Outside design of the heat network plant in Heerlen (Netherlands). Source: Smart Cities Marketplace
All this work on heat networks towards a more sustainable, inclusive and beautiful future is possible thanks to the fact that CARTIF is participating in several projects studying heat networks from different perspectives. Among them, REUSEHEAT and REWARDHEAT, where new generation heat networks are demonstrated with the integration of heat recovery from different sources, a project together with the JRC to study the NEB perspective on heat networks in Europe, or the NetZeroCities cities mission platform, where CARTIF will support cities to promote this kind of initiatives.
If you want to know more or need help with the NEB initiative or heat networks, count on us!
CARTIF is a Cervera Excellence Centre, granted by the Ministry of Science and Innovation and the CDTI, under the file number CER201910.
Co-author
Andrea Gabaldón:Energy researcher. Experince in energy modelling of district and building systems, district thermal networks, positive energy districts and energy communities. She works in european projects such as LocalRES, ATELIER and NETZEROCITIES
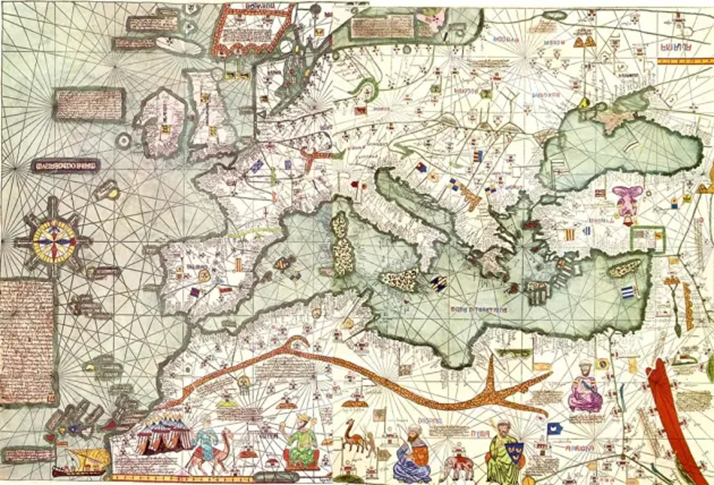
When we talk about the word map, the image of a drawing representing countries and oceans comes to mind. For the most veteran of us, maps can bring back memories of the times when we used to have those folded maps in our cars with the roads of Spain. We can even evoke those old maps, practically works of art, where the names of ports and sea towns were crammed on the coastlines, while in the waters we saw painted mermaids and sea monsters. However, we should aso think of maps as one of the most attractive and useful means of providing any kind of data that has a spatial relationship to each other.
Figure 1: Atlas of Cresques, 1375. Source: elhistoriador.es
In its simplest and most traditional concept, a map is a graphical representation that shows an measurable entity and object (e.g. road, city or even a continent) at a scale that can be represented on a physical medium (a piece of paper or a computer screen). It´s true that concepts and ideas that go beyond actual physical spaces also fall under this definition, and the distances shown by certain kinds of maps may not be something measurable, but rather that these representations show things like ideas or processes, as in the case of concept maps. However, these other types of maps are further away from the concept addressed in this post, where we will focus on the more classical definition, but without renouncing the advantages provided by modern technology (in this case, the most recent programming languages).
In cartography, maps are used to represent geographical entities in different locations considering different representation systems. These entities, in addition to their geometry, can include distances, altitudes, and a long list of attributes that help to improve their representation. However, over time, maps have been used to represent characteristics or attributes of the elements, statically or dynamically through their spatial relationship with a geolocated entity. As an example, we could put a map of the people living in a certain region (population density), or of the voters of a political party, or of the per capita income of the cities represented.
The data we refer to are ultimately qualities or values that are relate spatially or not to the elements represented on a map. Therefore, we can speak of data represented on a map, although the reality is that it is the whole that serves the intended purpose: the data have meaning not only in their numerical value, as we have in the case of a simple list of data, but also in their positional value, where the relative position of those data on the map is what gives them sense and meaning, not only to themselves, but to the whole.
Practical use of data in maps
One of the technological fields where it is necessary to work with data and their relationships between them is the programming of software oriented to data visualisation. Without departing from the classic concept of map, it is of great importance to use these tools so that the users of the software (or the people who visit the website) can have the data available, in a clear and accesible way, and above all, so that at a glance they can get an idea of the set of data is being displayed at the moment.
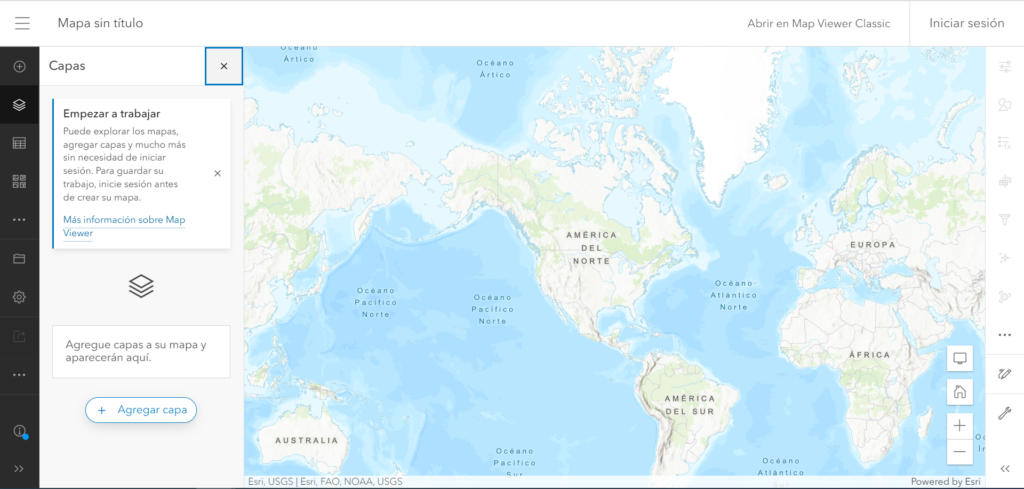
There are a number of design tools for implementing interactive maps in both desktop and web applications. The most popular of these are, on the one hand, interfaces that bridge to existing desktop applications (e.g. applications using ArcGIS modules), and on the other hand, libraries for handling embedded maps in popular programming language applications, such as the Leaflet library.
Figure 2: ArcGIS Interface.
The Leaflet library was launches in 2011 by the Ukrainian Volodymyr Agafonkin. This library is designed to work with JavaScript, and shows its usefulness in web applications for both computers and mobile devices, thanks to its small size (42 KB) and its good implementation, which makes it really easu to use from sides of the application, both by the user who browses the map, and by the programmer who writes the code that allows the map to do what its needed.
In addition to the above and considering the programming of interactive interfaces, it is important to have a library that allows not only to work with Leaflet, but also to use compatible components and help to integrate the whole set in a practical and easy to program application. In this case, the most popular and widely used library is React. And working with React, the best way to use Leaflet is through the integrated react-leaflet library, which will allow us to use each and every one of the features of this library, using the way React itself works.
This way of working with React, to give a brief outline, requires interacting with the objects in the code either through functions or using the concept of classes, understood in a similar way to that used in what is known as object-oriented programming. And this is how Leaflet works, highlighting the use of two concepts called the view and layers:
The view is the maps´s own sub-interface, which in turn contains all the uses and functionalities. For example, we could have buttons to show and hide data layers, zoom and search the map, and so on.
Layers are objects that contain the link to a specific dataset, as well as functions and properties that belong to the layer.
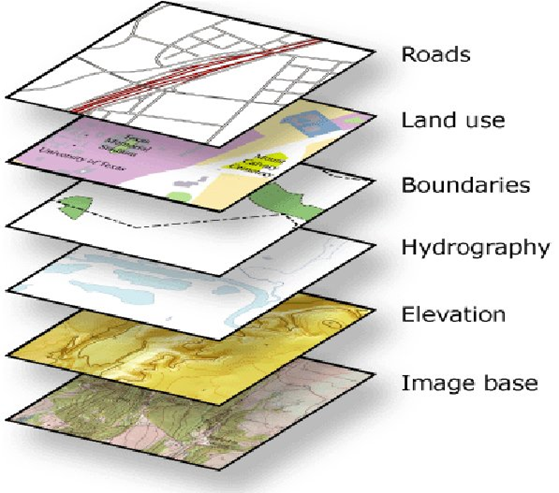
A view can therefore have several layers, which are the layers that contain all the data shown on the map. The map has one or more data layers, which show the information superimposed on the corresponding base layer.
Figure 3: Map layers. Source: Bibhuti Bhusan Mandal. GIS based online tenement registry for Indian mineral resources. Indian Mining and Engineering Journal. 2009. Vol. 45 Nº 9: 29-30.
To understand this concept a littele, a simple image of something that could be equivalent to this idea is the use of “transparencies” ( or “acetates”), which were used in the past to show slides: imagining an opaque sheet where a map is drawn, on it we can superimpose those transparent sheets, where our data is painted, in the form of polygons, marks, icons, arrows,etc. We can even superimpose several of these sheets, and we would see the data on top of each other, but all of them on the lines of the fixed map. The fixed map would be what we called before “base layer”, and the acetates would be acetates mentioned will be the data layers.
Figure 4: transparent sheets of acetate used traditionally for presentations, before the existence of Power Point.
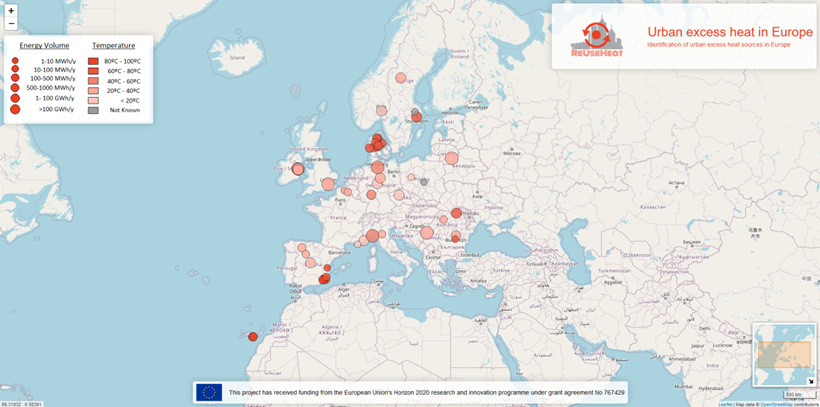
From CARTIF, we work on the implementation of solutions that use these technologies for the visualisation of geolocated data. As an example, we should highlight the ReUseHeat andePARCERO projects, where two applications have been developed for the management of geolocalised data. In ReUseHeat, the statistical visualiser allows to observe the sources of unused heat in hospitals, waste treatment centres, data centres and underground passenger transport. The base layer of the map belongs to OpenStreetMaps, and the data on potentially usable energy has been obtained from surveys carried out within the project. An interesting detail of the visualiser is to see how visualised objects are grouped into bubbles, which are broken down by zooming in on specific areas, improving the visualisation of the dataset. And all this is achieved through the use of Leaflet.
Figure 5: General view of the statistical visualiser of ReUseHeat
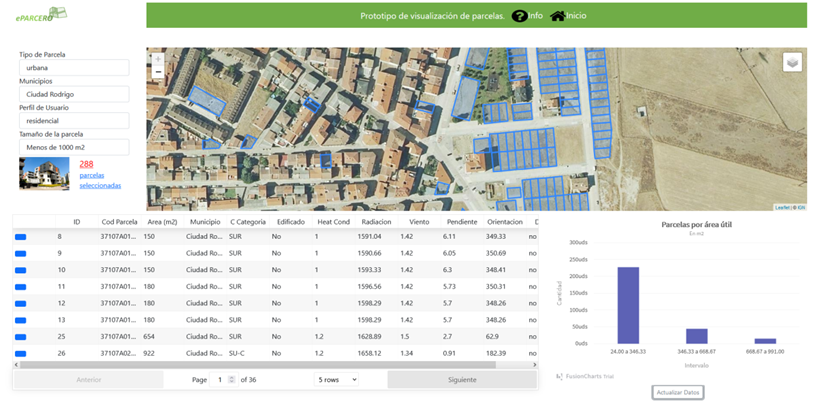
In the case of the ePARCERO project, whose prototype visualisation is still pending publication, the map is only one part of the tool, although it is the most important one. The map, which is coordinated with the data table at the bottom of the screen, as well as with filters on the left, shows the parcels selected as candidates of interest for users looking for parcels with certain characteristics, and which are currently not in use. The map allows to switch between two base layers, one the classic OpenStreetMaps one, and the other with the ortho-photo of the National Geographic Institute. As added details, apart from the pop-ups of the data when you click on one of them, the map auto positions itself when you choose a locality and makes the corresponding auto-zoom.
Figure 6: Parcels selection tool for the project ePARCERO. The silhouettes of the plots (in blue) positioned on the base orthophoto can be seen.
Present and future of interactive maps
As we have seen in the two previous cases, the usefulness that this type of tool has when displaying information on the screen is appreciable, going beyond the traditional visualisations in which the maps on web pages were only a pre-generated image, or that had to be generated each time data was modfied. Now, maps generated using Leaflet change, adapt, and are a dynamic tool on which to look at various data sets, and always serve the needs of a user who receives visual information that maximises its usefulness in this way. Most importantly, it allows the user to have no knowledge of maps, just a computer mouse and the curiosity to discover the data offered from the interface.
The future prospects for this technology offer new levels of detail in maps and new media to visualise plans and maps in three dimensions, beyond flat screens, allowing direct interactions with the represented element, as can be seen in the gradually more widespread use of virtual reality devices. But for the time being, the visualisation technology used more than meets expectations and proves its usefulness for the general public. From the Energy Division, we hope to make it as easy as possible for users to select and check data in increasingly comfortable and user-friendly interfaces.
Agreements to Susana Martín and Iván Ramos, from the Energy Division, for its comments and technical annotations in the present article.
We have already spoken on numerous occasions about the impact of cities on energy consumption and emissions generated to the environment. And consequently, also of the important role that they have to play in the necessary transition towards climate neutrality, the ultimate goal of the European Green Pact for our continent (as my colleague Rubén Garcia pointed out in a previous post, the aim is for Europe to be carbon neutral by 2050).
The road to this neutrality is paved with many interventions, larger or smaller, and covering a wide range of areas (mobility, energy, building rehabilitation, citizen involvement; digitalization…). District or city scale projects -Smart City- funded by the different European Union programmes (from the 7th Framework Programme, through Horizon 2020 and the current Horizon Europe) work on all these dimensions with the idea of generating real demonstrations, and showing the path (or possible paths) that other cities can follow. Obviously, experts in different fields are needed to cover the various areas of competence covered by these projects.
In CARTIF we have been coordinating and working for many years in numerous projects along these lines, and also participating in many of the areas of work of these giants, which are so much in variety of activities as in the breadth of the time scale.
Recently one of these “lighthouse” project in which we have been working during years has finished, SmartEnCity. 78 months of work shared by 38 partners of 6 different countries in a project funded by the Research and Innovation Programme Horizon 2020 of the European Union, and coordinated by Tecnalia, in which it has been intended to make real the vision of convert our european cities in intelligent and zero carbon emissions.
In the project SmartEnCity three lighthouse cities has participated: Vitoria-Gasteiz in Spain, Tartu in Stonia and Sonderborg in Denmark. In all of them different intelligent and innovative solutions have been deployed in different areas with the idea of reaching the desired neutrality.
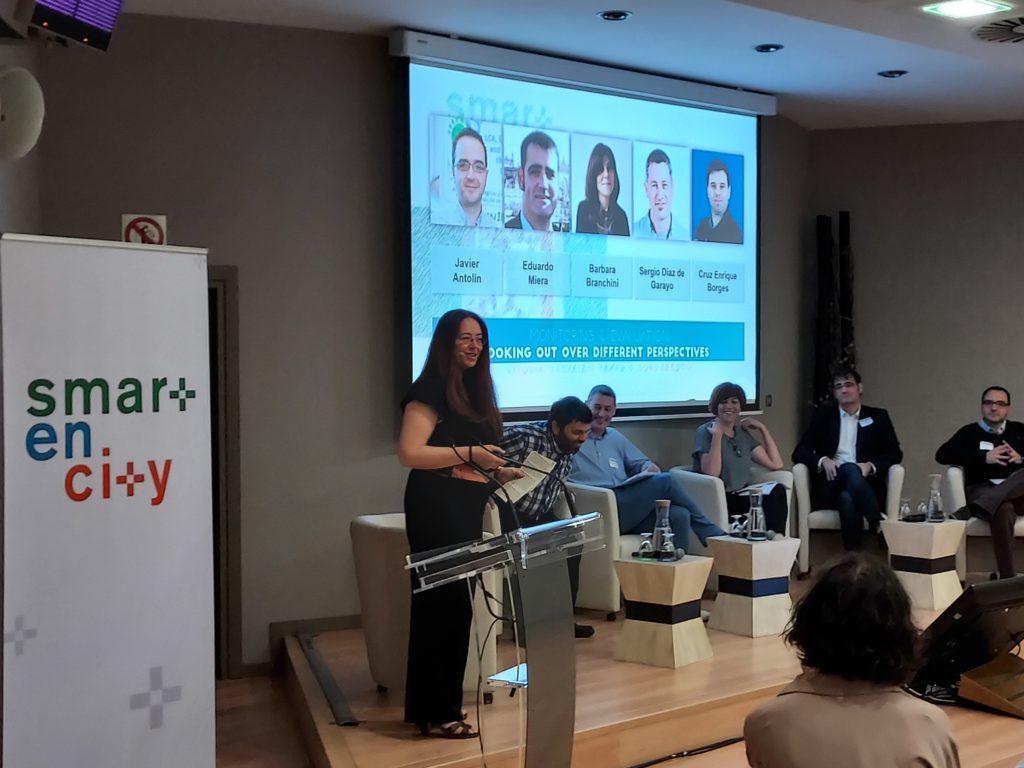
Discussion table of the Final Conference of SmartEnCity
As a finishing touch, the last 14th and 15th of june, the project celebrated its Final Conference at the Europe Congress Palace, in Vitoria-Gasteiz. More than 120 participants attended the two-day event during which project results and plans for a carbon-free future were presented through keynote speeches, presentations, discussion sessions and moments of interaction by thematic areas.
Julia Vicente and Javier Antolin at the Final Conference of SmartEnCity
I had the honor of participating and moderating one of the discussion tables that focused on one of the aspects in which CARTIF has been working for years and in which we have extensive experience: monitoring and evaluation. A key aspect to quantify the real impact that these projects achieve. In this case we tried to address these often difficult aspects in a way closer to the audience, sharing the experiences of different experts and projects around the most important aspects to take into account when evaluating project activities, the major problems encountered, solutions implemented and, finally,main lessons learned. I was lucky enough to share the debate with my partner Javier Antolin, who represented the REMOURBAN project, coordinated by CARTIF and which counted with Valladolid as one of its lighthouse cities. MAtchUP, ATELIER, Replicate and Stradust were also present.
One of the common aspects that we could all see is the enormous importance of citizens in the viability and success of these projects. This has a direct impact on the evaluation results and process itself. The transition to emission-neutral and sustainable cities in the broadest sense of the word can only be achieved if we, the citizens, are involved in the transformation process. If we are not barriers but vectors of change. If we go from being spectators to main characters.
From CARTIF we continue and will continue working on projects of theSmart Cities area with the idea of moving towards the horizon of sustainable cities. Will you join us on the way?
Last June the European Commission (from the Energy Poverty Advisory Hub: EPAH) published a handbook as a guide to understand and addressing energy poverty, which has become a reality in Europe, and particularly in Spain. Although there is no agreement on a common definition of energy poverty, it is widely accepted that there is energy poverty when people cannot maintain an adequate temperature in their homes (either by heating, cooling or applying energy solutions to an affordable cost). The extent and seriousness of the problem has been aggravated in recent months by climate change, whose consequences in the form of heatwaves or extreme droughts are already perceptible and throughout the entire European continent; and by the energy crisis in Europe as a result of the invasion of Ukraine.
The commitment of the European Commission (EC) to address the challenges related to the climate and the environment was ratified with the European Green Deal. It is established as one of the main priorities that the EU must transform itself into a fair and prosperous society, where there are no net GHG emissions in 2050 and where economic growth is decoupled from resource use. In addition, it is reaffirmed that this transition must be fair and inclusive, therefore alleviating energy poverty is a key precondition in this context.
Energy poverty is a complex challenged linked to several factors, so there is no single reason that we can point to as the sole cause, in addition to the fact that its nature varies greatly from one local context to another, and that it occurs at domestic level, which makes its identification and quantification quite difficult. Energy poverty also has consequences for the people´s health and well-being, since extreme indoor temperatures are related to respiratory and cardiovascular diseases, heat stroke or excess deaths. In children, it can also have consequences related to poor school performance, as well as the development of respiratory health problems at an early age, and lower social and emotional well-being.
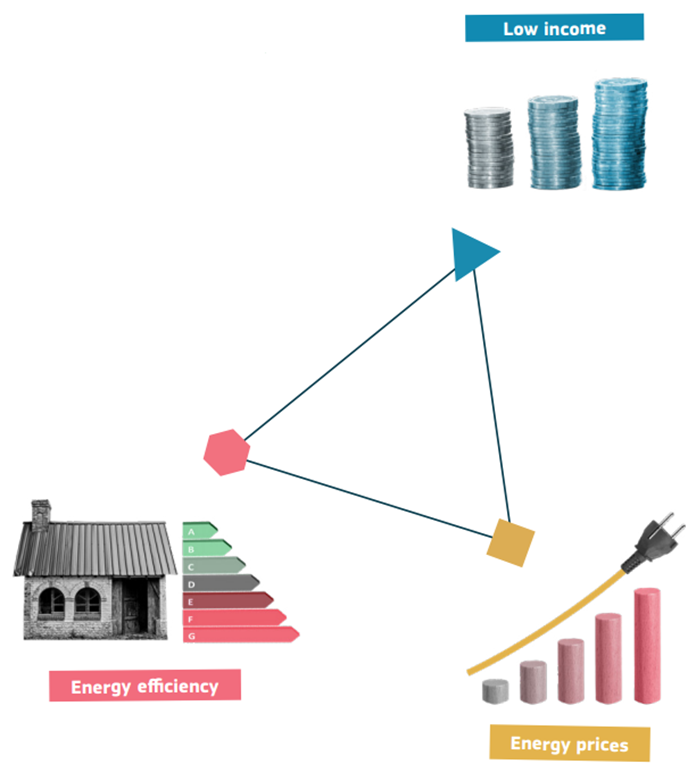
In general, the most common causes that lead to energy poverty are three; low income levels, a lack of energy efficiency in housing, as well as the low energy efficiency of buildings and their systems, and the high energy prices.
Related to these three causes, it is also worth nothing the great influence of climate change, making energy poverty a problem for the most vulnerable groups not only in winter, but also in summer, as a result of the high temperatures recently recorded due to heatwaves.
And these recent heatwaves have broken temperature records around the world this summer, and their impacts and consequences for society and the environment are being dramatic in the form of forest fires and devastated crops, key infrastructure affected (e.g. power cuts electricity supply, deforming roads and tracks, etc.) and causing serious health problems in thousands of people (in addition to increased mortality).
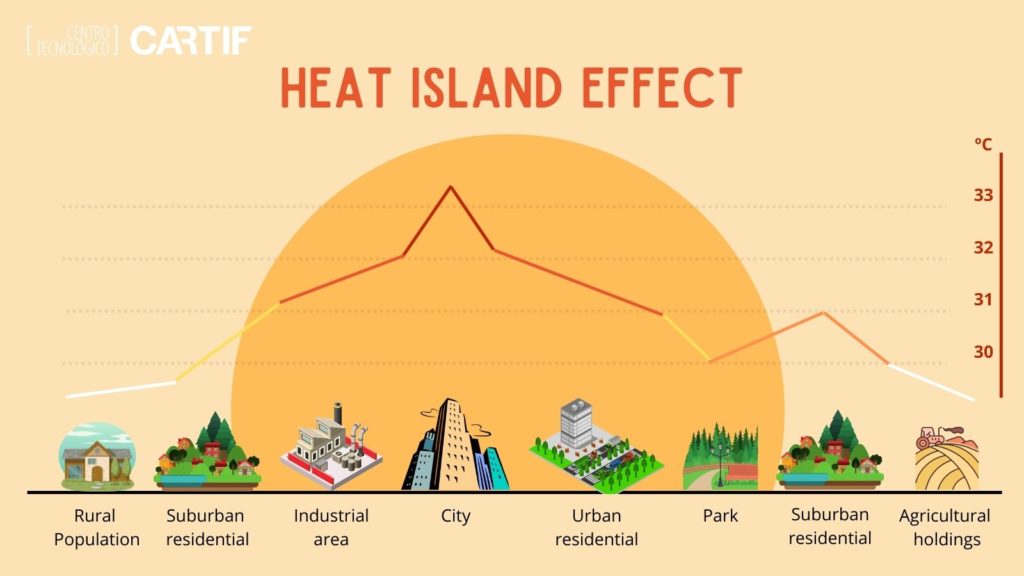
In cities, the problem is even greater, as it is exarcebated by the so-called heat island effect, a phenomenon caused by changes in the reflectivity (or absorption) of the sun´s energy on the earth´s surface, with the consequence that the temperature rises in urban areas. This is because buildings, pavements and roofs tend to reflect less sunlight than natural surfaces, absorbing, retaining and re-emitting the sun´s heat.
If we continue analysing the previously identified causes of energy poverty, it is well known that in Spain there is a significant number of buildings with low energy performance. This is either because of their low efficiency in passive terms (the thermak envelope is not adequately insulated and that involves significant losses in winter and thermal gains in summer), or due to the low performance of the heating and cooling systems. It is that, as a whole, buildings are responsible for 40% energy consumption in the EU, and 36% of greenhouse gas emissions, so it is necessary to place a particularly important focus on the energy retrofitting of buildings already built.
An important advance in this sense comes from the hand of the recently approvedLaw on the Quality of Architecture (Ley de la Calidad de la Arquitectura), which aims to guarantee the quality of architecture as a good of general interest, and responding to social, environmental and revaluation issues of architectural heritage.
With respect to energy prices as a cause of energy poverty, the Russian invasion of Ukraine has cause an increase in energy prices not only in Spain but throughout Europe, specifically fossil fuels. As the recent United Nations report on the Global Impact of the War in Ukraine: Energy crisis points out, this increase in energy prices is accelerating the cost-of-living crisis, and maintaining the vicious cycle of constrained family budgets, increasing food and energy poverty, and increasing social unrest. This crisis is having a deep impact on vulnerable population in developing countries. Although during the two years of the pandemic energy market experienced great volatility in prices (due to reduced demand), the war in Ukraine has affected the supply of fossil fuels and the market in general, in which Russia is the main exporter of natural gas and the second exporter of oil.
What can world leaders do in the face of this rapidly changing situation?
All this leads world leaders to rethink their energy policies and plans. Well, while in the short term, countries must first seek to manage energy demand (new technologies, behavioural changes in energy consumption patterns, support from passive systems, etc.), medium and long-term measures for aligning with the Sustainable Development Goals, as well as with the Paris Agreement, emphasizing the use of renewable energy sources and the need for climate/energy resilience. In Europe especially, this may also be an opportunity to direct efforts towards the goal of becoming the world´s first climate-neutral continent by 2050.
What we do from CARTIF?
From the CARTIF Energy and Climate Policy area we work to help the different public administrations in the development of plans and strategies for adaptation and mitigation against climate change, such as the plans framed in the Covenant of Mayors where, in addition to taking measures to mitigate climate change and adapt to its inevitable effects, the signatories commit to providing access to safe, sustainable and affordable energy for all, thus helping alleviate energy poverty.
CARTIF, together with GEOCYL Conultoría S.L., is currently developing the Sustainable Energy and Climate Action Plan of Logroño and among other research projects it is worth highlighting the NEVERMORE project, where we work on the development of methodologies and tools for the evaluation of measures of adaptation and mitigation and various scales, which serve as references for politicians when defining their climate and energy strategies.