COP27: why decisions on climate change made at this summit affect you?

COP27: why decisions on climate change made at this summit affect you?

From November 6 to 20, the 27th Conference of the Parties took place in Sharm el Sheikh, where state leaders met in search of agreements against climate change and the definition of an action plan to deal with the challenges current. In this blog we reveal the conclusions about this conference and why this topic should interest you.

Climate change…I´ve heard about it, but why should I care?

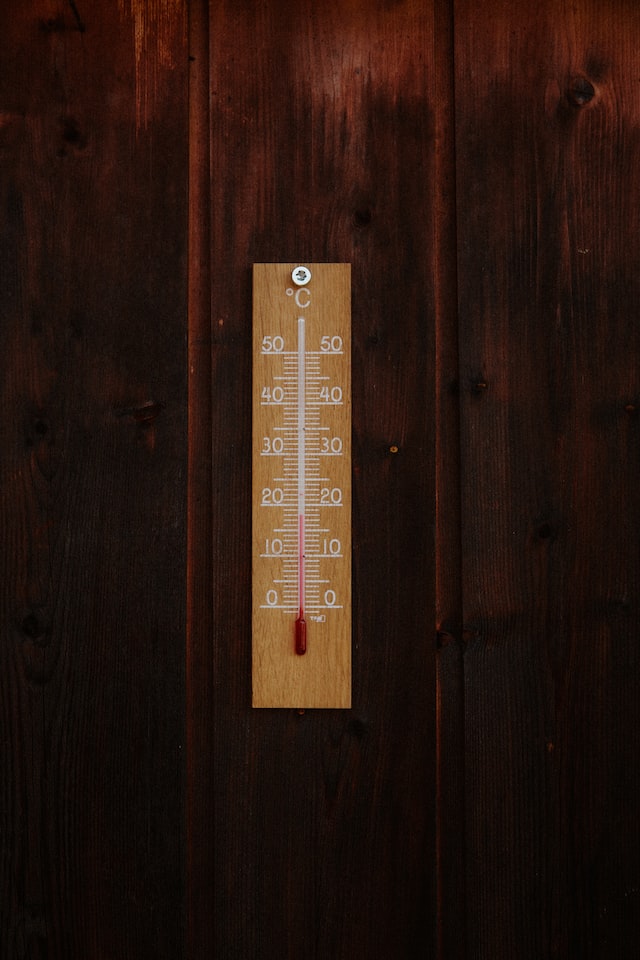
When we talk about climate change, a large part of the population relates it solely to the increase in temperature. And yes, they are right, the severity of climate change is evaluated through the increase in temperature, but it is the consequences derived from this increase in temperature that should concern us, as well as its causes, in order to combat it. Listed below some relationships that seem somewhat contradictory:

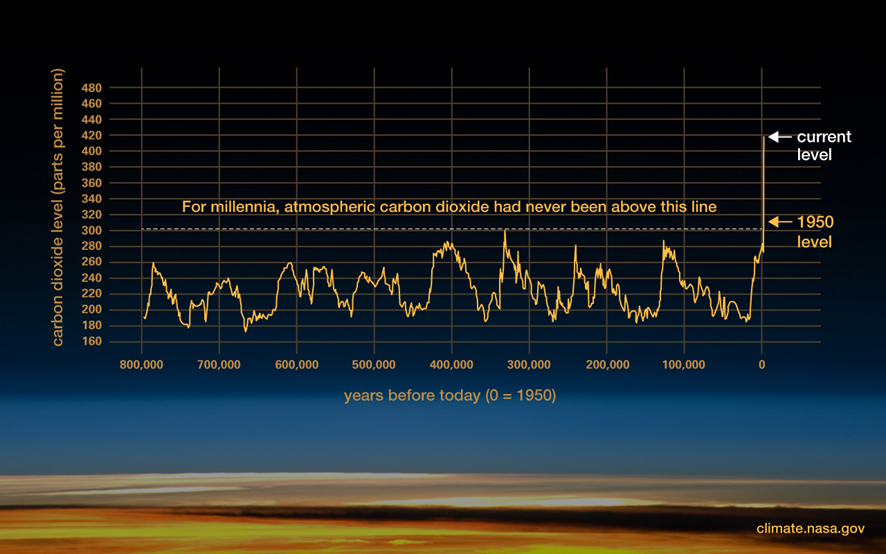
Cyclical changes in the climate have always existed, this is one more: yes and no. For 100 thousand years there have been very considerable climatic changes and in a cyclical way. However, with the arrival of the Holocene, 10,000 years ago, the temperature on Earth stabilized, only varying its average temperature within a range of one degree Celsius. This facilitated the development of a stable and predictable planet. It is, in fact, the only period in which we can ensure that the development of human life can take place. However, human activities and the consequent increase in greenhouse gases in the atmosphere have made us leave the Holocene, entering the Anthropocene, an unprecedented situation, as can be seen in the graph below.

https://climate.nasa.gov/evidence/

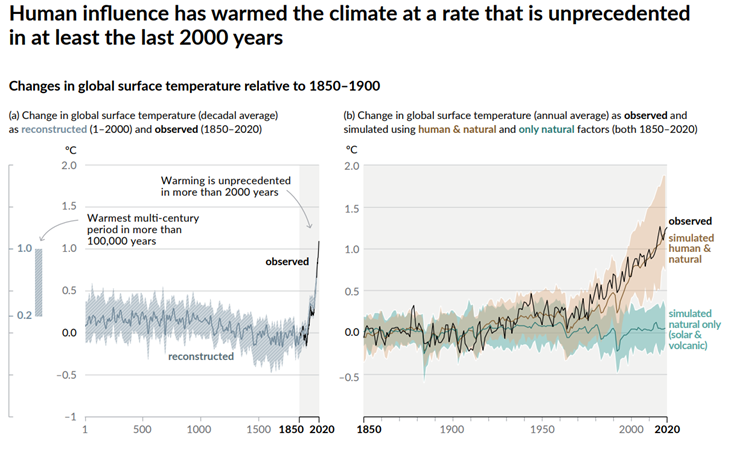
This time is characterized by an exponential increase in temperatures, as you can see in the graph below, extracted from documentation of the Intergovernmental Panel against Climate Change (IPCC).

Valérie Masson-Delmotte et al., “Climate Change 2021: The Physical Science Basis,”

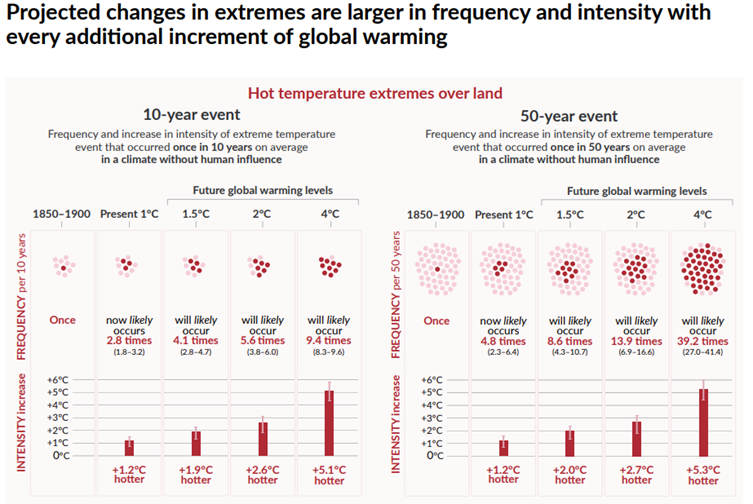
The temperature rises, but it is colder in winter: the entry into the Anthropocene and the rise in temperatures have meant that we are at risk of completely destabilizing the Earth’s atmospheric processes and breaking their balance. It is precisely this imbalance that causes more extremes in temperatures, both in winter and summer. The graph shows the frequency of extreme events that would exist depending on potential future temperature increases.

It rains more, but there are more droughts: an increase in the Earth’s temperature also affects the temperature of the oceans. Since warm water occupies more, this carries a risk for all coastal areas that could be affected by the rise in sea level, and also has an impact on the progressive melting of the poles (whose decrease in surface area also reduces the capacity of the Earth to reflect solar radiation). However, what is not so immediate is the alteration of the water cycle: as there is more water vapor in the environment, more intense storms are produced. This can lead to heavy and frequent flooding, as well as the occurrence of hurricanes. In fact, events like Hurricane Sandy in 2012 are estimated to occur annually starting in 21001. But what about droughts? When there is an increase in temperature, a greater amount of water evaporates from the soil (again contributing to the destabilization of the water cycle). When it returns in the form of intense rains to the ground, the ground is not capable of absorbing this amount of water at this speed, which contributes to floods derived from these intense precipitations. In addition, due to other types of processes, the absorption capacity and quality of the soil is currently reduced This has several consequences, such as the lack of food security. To learn more about this topic, I recommend this documentary: “Kiss the Ground”.

Therefore, the problem of climate change is not only the increase in temperature, but also all the consequences derived from it and the imbalance that it implies in the ecosystemic services the Earth provides. For all these reasons, the temperature limit is set at 1.5ºC, which is what allows it to operate in a safe environment. However, it seems easy to overstep it.

And what has been decided at COP27? Are the agreements that have been made enough?

Currently, we are not doing enough reduce GHG emissions and stay within the limit of 1.5ºC of temperature increase. Although there are different opinions about the results of COP27, a fairly general feeling is that, although the 1.5ºC target set in the Paris Agreement and renewed at COP26 in Glasgow has been maintained, much more needs to be done. In particular, the countries that emit the most have not committed to eliminate fossil fuels, nor to establish new agreements to contribute to the mitigation of climate change2.

However, a positive point of COP27 is its support for the most vulnerable countries, focusing the discourse on climate justice. Indeed, the harshest consequences of climate change end up being suffered by those countries that contribute the least to it and are more vulnerable. In fact, according to the 2018 Lancet Countdown Report, it is estimated that there could be one billion climate migrants.

Every tenth of a degree counts. The consequences of not acting and even temporarily exceeding this limit of 1.5ºC can lead to severe risks, some of which may be irreversible, according to the latest IPCC report. Globally and in a coordinated way, we have to adapt to these new circumstances, but also mitigate the future consequences of climate change. However, these mitigation and adaptation actions can only be applied at the local level. To give you some ideas of what can be done, I recommend a project we are working on at CARTIF, as well as provide additional references.

How does CARTIF contribute to the fight against climate change?

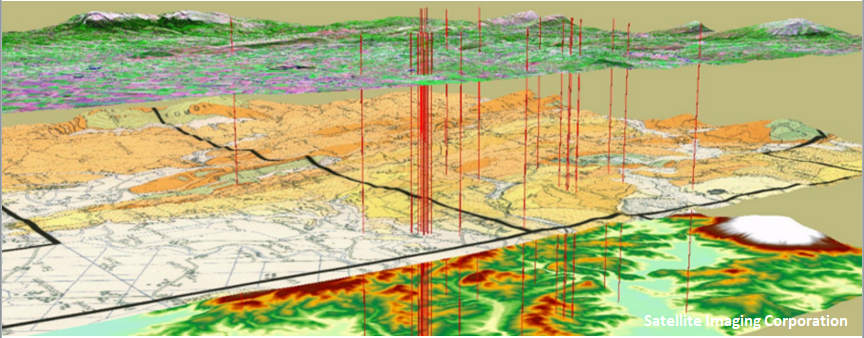
At CARTIF, especially from the Energy and Climate Policies area, we work on the development of models (at different scales), tools and solutions to analyze climate change and propose adaptation and mitigation solutions. In particular, in the RethinkAction project (GA 101037104) coordinated by CARTIF, we will develop an integrated evaluation platform to simulate and evaluate adaptation and mitigation solutions based on land uses. This analysis will be carried out both at a local, European and global level, as well as over time, which will allow both the general public and those in charge of making decisions to better understand the impact of its application. To do this, we will develop system dynamics models that we will apply both in the 6 case studies (representative examples of the impacts of climate change), and at a European and global level, and we will rely on georeferenced satellite information.

If you want more information…

I propose the consultation of three sources.

1. First of all, the most relevant documentation is that generated by the United Nations Intergovernmental Panel on Climate Change (IPCC), where reports are periodically generated to assess the climate change situation, focusing on various areas. In particular in the latest report they focus on the impacts of climate change, adaptation and vulnerability.

2. Secondly, I suggest the simulator of the EN-ROADS tool, developed by CLIMATE INTERACTIVE and MIT to analyse future scenarios and the consequences on temperature depending on the policies applied in various fields such as energy, transport, etc. .

3. Finally, it is worth highlighting the work of the Stockholm Resilience Center and the research orchestrated by Johan Rockström. These experts have analysed certain limits (planetary limits) in a series of areas that should be respected (see image below). They are points of no return where, once passed, we could not go back and they would cause the functioning of the earth to get out of control. As can be seen, many of them are related to climate change, but also to the pollution we generate, the use of water, etc.

Source: https://www.stockholmresilience.org/research/planetary-boundaries.html

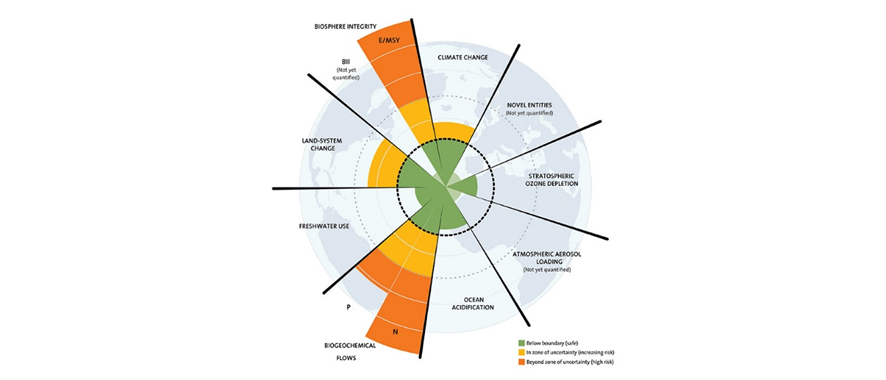
In addition to being able to consult the scientific articles where this theory is exposed (here I leave an article), I recommend viewing the documentary that they have made about it, called “Breaking boundaries: The Science of Our Planet”. According to the documentary, the main message is hopeful: we still have time. It also highlights four main lines of action:

  1. Reduce greenhouse gas emissions to zero
  2. Protect all those terrestrial elements that contribute to absorbing our impacts (wetlands, soils, forests and oceans)
  3. Change our diets and the way we produce food
  4. Move towards a circular economy.

While many decisions should be made at a higher policy level, how can you use your voice, your vote, and your choices to contribute to this fight?

Your world depends on it.


1 Georgina Gustin, “U.S. Coastal Cities Will Flood More Often and More Severely, Study Warns,” Inside Climate News, June 7, 2017. https://insideclimatenews.org/news/07062017/coastal-flooding-extreme-sea-level-rise-forecast

2 Statement by President von der Leyen on the outcome of COP27 https://ec.europa.eu/commission/presscorner/detail/en/STATEMENT_22_7043

Geographic Information Systems and their application in the energy field

Geographic Information Systems and their application in the energy field

Even though the term Geographic Information System (GIS) is well-known, it is possible that many of you don’t know what applications it might have or its relevance in the energy field. Put in short, GIS (or SIG, in Spanish) are all software in charge of the treatment of data containing some geometric characteristic and that can be reflected on a map in their precise position. These data can be 2D or 2,5D* (described with points, lines and polygons), 3D, or cloud points (LIDAR data). Moreover, these geographic data are normally associated to attribute tables, where information on them is introduced. For example, we can have a map with the provinces in Spain and in the attribute table have assigned to each polygon representing a province their demographic data, economic data, etc.

One of the most remarkable aspects of these systems is not only being able to visualize elements in their precise geographic location, but also that these layers of information can be overlapped allowing to visualize at the same time geographical elements displaying different realities. This is quite straightforward and we are very used to seeing it in phone apps, for example GPS apps, where we can observe a base map (a city map or a satellite image) and several layers that are placed on top of it, such as the name of the streets, stores, etc.

A part from being able to use these systems in order to guide ourselves in cities (which is no small thing) the potential of these systems lies in being able to perform spatial analysis, which would be impossible with other means. This way, we could have answers to questions like the following:

  • What would be the floodable areas by this river?
  • If an incident occurs in this area, which are the closest hospitals? What would be the best route for ambulances with respect to distance? And with respect to time?
  • Where should the stops of this bus line be placed in order for them to be spaced at a maximum of 600 meters? Which areas in the city would benefit from it considering a radius from the bus stop of 10 minutes walking?
  • How have forest areas been modified in a concrete zone? Is there risk of desertification?

These only represent a small sample of the reach of GIS, which proves extremely useful to carry out planning activities in a wide range of fields (risks and accidents, traffic management, transport networks, environmental impact assessment, agriculture, natural risk assessment…). But focusing on the energy field, GIS have also a great potential for the support in the development of energy plans, compliance with energy directives and result monitoring. For example, we could get to know which areas are in need to perform an energy retrofit. To this respect it is worth mentioning as an example the map developed by the University of Columbia on the estimated consumption in New York City.

Additionally, several different scenarios can be evaluated where the effectiveness of the different actions is measures or if a determined area can be supplied by other type of energy source (renewable, for example). Calculating these indicators it can be checked if the objectives imposed in a determined directive are complied with or not.

In CARTIF, and in particular in the Energy Division, GIS are exploited and their applications to support to the compliance with the European Directives in the energy field, more specifically to the Directive package “Clean Energy for All Europeans”. Moreover, special attention is paid to the study of the data structure and the standards that should be followed to assure its interoperability. In this sense, it is worth highlighting the open standards proposed by the Open Geospatial Consortium (OGC), and also the INSPIRE Directive, which defines the infrastructure for the spatial information in Europe and which will be applicable in 2020.

This latter aims at harmonising and offering geospatial information in Europe in a range of 34 themes. Even though none of them is strictly related to energy (these aspects can be assigned to build elements, such as buildings (BU)), the study of the most relevant energy attributes is crucial in this moment prior to the implementation of the INSPIRE Directive, as it has been manifested by the European Commission when defining a project that studies the potential of the Directive in the energy field: the “Energy Pilot”. CARTIF, aiming for innovation and the alignment with the EU collaborates in this project interacting with one of the reference centres of the Commission: the Joint Research Centre in Ispra.

*Note for the curious: for example a cube can be considered 2,5D when it is defined instead of with eight vertexes with x, y and z values, it is defined only with the four above, since those contain the “z” value in contrast to the four lower vertexes, where this value would be 0.

Are energy performance certificates really useful?

Are energy performance certificates really useful?

Six more aspects to know everything about Energy Performance Certificates

Even though at first sight Energy Performance Certificates required nowadays when selling or renting a property might seem a burden for the owner; they are a huge source of information for the future property tenant or buyer. When choosing a new residence or premise for rent or sale, its price, location or size should not only be what matters to us, but we should worry as well about its energy demand and, thus, the expense that it will generate in the future. If those topics matter to us when we buy a car or an electrical appliance, why shouldn’t they matter to us as well when talking about real state with a much higher repercussion?

  • What is it?

The Energy Performance Certificate is a report written by an accredited person, which entails a global rating of our property based on the carbon dioxide emissions that we are producing through heating, domestic hot water, cooling and lighting. Moreover, it also provides us with the energy demand coming from heating and cooling and primary energy consumption. At the end of the certificate a series of recommendations are offered to us in order to improve our rating and, therefore, save in our invoices.

  • What does the energy rating mean?

The rating obtained is organised in a scale that ranges from A (most efficient) to G (less efficient), which depends on our CO2 emissions. This scale is not proportional and, for example, the difference between an A and B rating is much lower than the one existing between an E and an F, as it can be seen in the picture.

  • How is it done?

An accredited person will visit the property and will gather information regarding windows, building envelope, energy systems, and hot water production system and, in case of business premises, information related to lighting. The data is introduced in a tool validated by the State (CEX, CE3X, HULC or CERMA in the case of Spain), where the certificate will be issued. Moreover, this certificate should include at least two recommendations about how to reduce energy.

  • What are the recommendations about how to reduce energy?

The energy certificate tool asks to introduce recommendations which can be classified into four categories: insulation, windows, thermal bridges and building systems. The accredited person will have to value, after having covered the previous steps, which are the best recommendations to offer in each case. This means carrying out an energy audit of our property, which provides us with highly valuable information to be able to implement an energy retrofit.

  • Dwelling certification vs certification at building level, what is mandatory?

Energy certificates can be done both for the complete building, as well as for individual business premises or dwellings. For buildings built less than 50 years ago it is not mandatory to issue a certificate at building level (except regional or local specification), therefore it is common practice that the owner requests this certificate whenever he or she has to rent or sell their property. However, it is worth noting that issuing the certificate at building level is less expensive than the individual ones.

If our building is more than 50 years old or we want to apply for a grant we will be asked to carry out the IEE (in Spanish – Informe de Evaluación del Edificio – a building assessment report) which specifies the conservation state of the building, the accordance to the accessibility regulation and its energy efficiency rating at building level. Certification at building level is compulsory either way for new buildings.