In recent decades, the evolution towards a genuine energy and environmental transition has taken a fascinating course. Our social and productive system is undergoing an unprecedented transformation, and the major issues that characterise the 21st century, such as energy, digital security and socio-economic issues, among others, cannot be addressed separately. This is precisely why the digital transformation today offers new ideas and opportunities also in the purely energy field. The power of data is now obvious to scientists, engineers and economists, but it can be beyond the reach of ordinary citizens, who often lack the means to understand how much this tool can help them in their daily lives. A concrete example is how, using data collected by smart meters installed in our own homes, we can actively monitor and modify consumption profiles, whether for electricity, water or gas, to the benefit of the environment and of our wallet.
Previously, the energy market was centralised and mainly driven by a few large suppliers. However, it is now undergoing a decentralisation and orientation more in line with the real needs of individual consumers. The individual, once a mere passive recipient of energy services at home, can now aspire to be actively involved in the various stages of the production process thanks to the integration of renewable technologies into local grids and the development of Renewable Energy Communities (REC). This change in the traditional perspective of our energy market is already underway.
In this context, the energy prosumer is the key figure in each REC, combining the more traditional producer and consumer. The prosumer can cover their energy demand as independently as possible from the grid, taking advantage of their self-consumption and storing or selling the surplus to the grid. In a renewable energy community, this surplus production can be used to meet the energy demands of other members. All this implies the need for the prosumer to be aware of the production process in which he/she is involved and the functioning of the energy market.
Being active citizens and possibly involved in renewable energy communities has significant implications from a social perspective. Strata of the population with limited accees to energy supplies, either due to financial means or difficult access to the grid for geographical reasons, could benefit most substantially from local production and the formation of energy communities. The active participation of individual citizens in decision-making processes generates notable benefits, among which are, without a doubt, greater acceptance of renewable energies, as well as a greater social cohesion in the community, which by its very nature is democratic and equitable, overcoming disparities associated with gender, age or individual economic capacity. On the other hand, from an economic point of view, it is crucial to highlight that self-consumption of energy leads to significant savings in energy bills, due to a lower purchase of electricity from the grid. Furthermore, the formation of energy communities can mobilise capital at the local level and attract investment.
Within the framework of Horizon Europe, the European Union(EU) research and innovation (R&I) programme for the period 2021-2027, CARTIF is involved in the ENPOWERproject. We want to contribute to the energy activation process of European citizens and to the development of renewable prosumer communities through innovative data-driven strategies. On the one hand, it is crucial to identify the impacts of the project considering parameters covering both social and environmental factors. On the other hand, we seek to assess the level of commitment of engaged European citizens, with the explicit aim of fostering the cohesion of individuals towards energy independence.
What is generally understood by Artificial Intelligence – or AI?. It is a pervasive term nowadays, that appears not only in secluded and obscure academic circles hidden from the rest of society. Most of us have, to some degree, already heard the term. AI is not just-yet-another buzzword; and it is here to stay. This is not really news: many examples of success stories of AI-based systems have been hugely popularized by media (AlphaGo, DeepBlue, Chat-GPT, to name a few). The boom of Deep Learning and its application to an extremely wide spectrum of areas have also helped masively spread the word in very recent years. Because AI is transversal; AI technology is most of the time task-agnostic. This means that AI methods are susceptible to be used to support an enormous range of very different applications and problems.
And, while this is absolutely true, there is an important gap between what AI means to people working in AI research and to people outside of it (general public, policy makers, technological companies, different economic sectors…). Don´t misunderstand me, such a gap is natural: specialists in any area have their own jargon to address subjects in a specific manner compared to non-specialists. But I also think that 1) efforts to close this gap and demystify AI can have a very positive impact, and 2) this can foster a much better ecosystem for research and innovation in all economic and societal sectors, and at local, national and international levels.
Here are my two cents on this: a large part of the gap comes from linguistics. Take this opinion with a grain of salt and draw your conclusions from the AI-based systems that you might come across.
I bet you have probably heard, whether in the news, when taking to friends, or when working on a project involving AI, a statement similar to:
"This system is an AI. This AI is intelligent. The AI does this like a human specialist would"
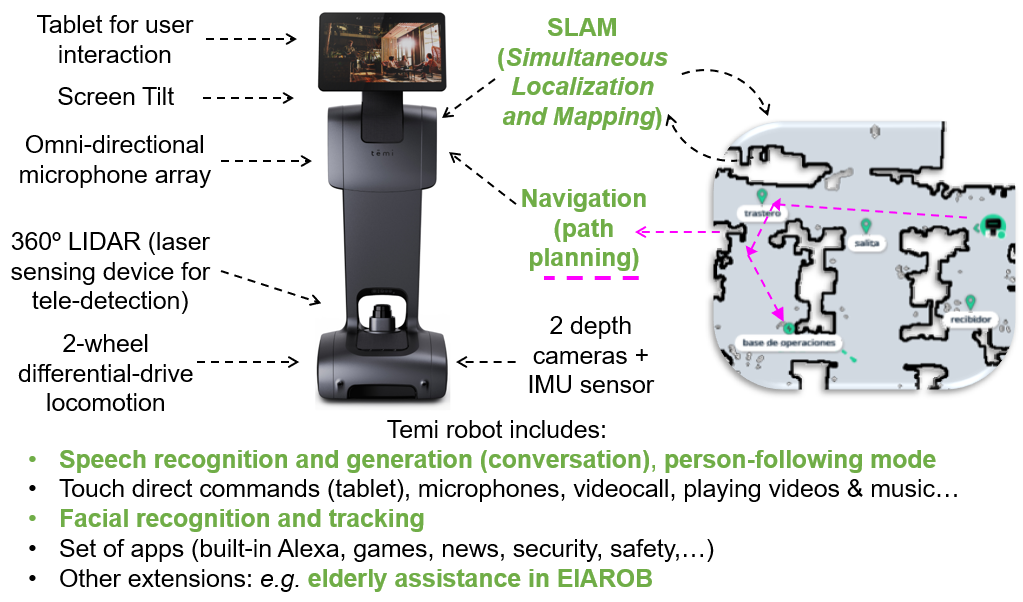
I have three problems with these statements, and the problems are linguistic, not technological. I will explain them from a practical point of view using an example of a system that includes AI methods in a project from the area of Health and Wellbeing at CARTIF: a robot of the Temi model (called Matías) in EIAROB project, which is a social robot that will be deployed in the homes of elderly people during the project, to help monitor and accompany them, thus enhancing the people´s wellbeing, reducing solitude, and extracting information about the people´s health status and its progression for their medical professionals. In this context, the capabilities of the Temi robot are described in the following figure.
Functionalities of Temi robot; in green those that include AI methods. Temi robot is used in the EIAROB project, in which CARTIF participates, innovating in the creation of new extensions to the robot that support the wellbeing of the elderly at their home.
The three issues that I have with the previous statements about AI are:
An app or an artificial system is not and AI or an Artificial Intelligence; the app or system might include elements that use AI methods or may be based on AI; AI is a field of study, as is for example Physics, Chemistry or Biology. For example, the Temi robot is not an Artificial Intelligence; it includes elements that use AI methods (in green in the figure, such as speech recognition and generation for conversation).
Saying that an artificial system is intelligent, while absolutely valid, is a language shortcut that we must be aware of. The system might use AI mechanisms, but they don´t function in the same manner as a person said to be intelligent. An effort should be generally made in trying to avoid putting human properties on artificial systems gratuitously (anthropomorphizing). For example, saying that the Temi robot is intelligent because it can maintain conversations is a language shortcut; it includes AI (Natural Language Processing) methods that are able to interact in plain language with humans, but these methods are actually statistical, and are not an actual representation on how humans process language in their brains.
An AI-based system delivers a function. It is possible that the system includes mechanisms, methods or algorithms that are inspired, mimic or model how humans would approach the problem. But ultimately, the system does not use the same process that humans use. It contains elements that might have been designed thinking of how humans would approach a problem (for example, based on math, statistics, logic or computations), but they make abstractions and approximations and, as such, cannot be said to do things the way humans do. For example, some of the mechanisms used by Temi robot to talk with humans are based on artificial neural networks, which is a set of AI mathematical and statistical methods that allow to recognize and generate language in the conversation. Such artificial neural networks methods, in their inception (1950s-1970s), were very loosely inspired by how neurons work in the biological brain, but do not aim to reproduce it.
These factors will not change the way AI-based systems are created , but they could change the way we think of AI-based systems. Thus, rather that speaking of “Artificial Intelligences” as systems, I advocate for talking of “systems with AI methods” or “AI-based systems”, and consciously trying to be clear and specific when speaking of AI. Let´s not forget that the purpose of any artificial system is to have a positive impact in people´s lives. People should be at the center of all engineering efforts; consequently, AI-based systems should be thought of as tools to support people and be understood as such.
In CARTIF, we work on a wide spectrum of projects that involve applied AI for different purposes, and at every step of our R&D&I efforts we keep our eyes on the goal of creating or improving processes that ultimately will serve people and society. As such, the systems that we create and develop in these projects are systems with AI methods, or AI-based systems, but they are not “Artificial Intelligences”.
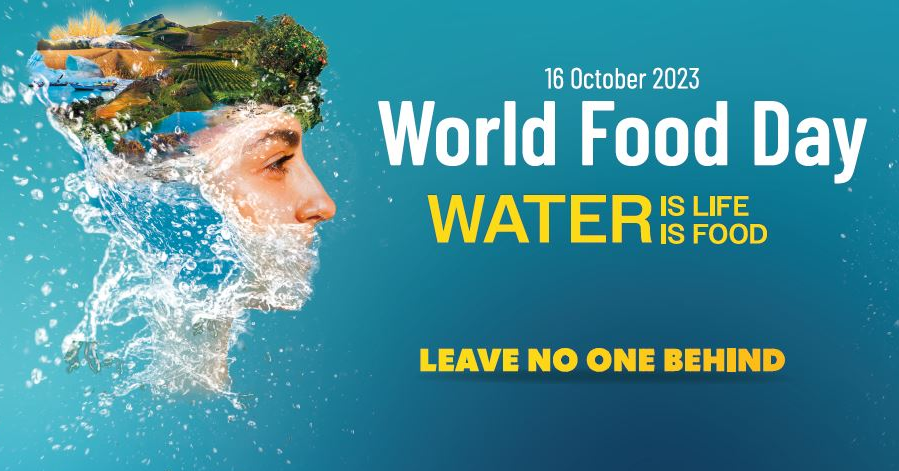
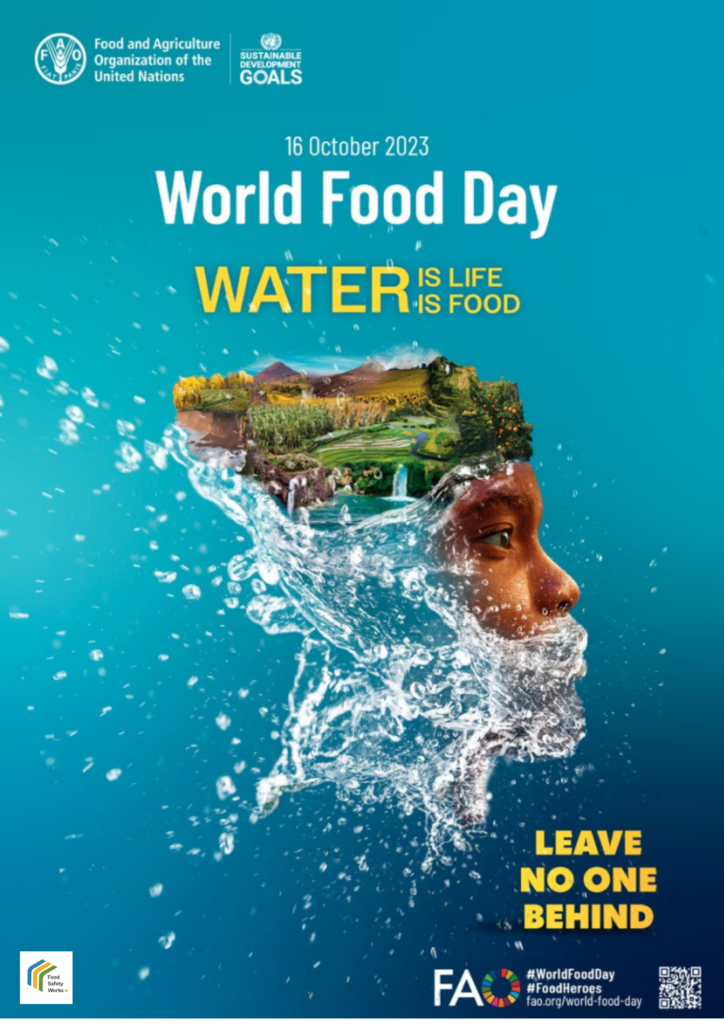
Today, 16th October, we celebrate once again a very important date for each and every living being of the planet; World Food Day. This time, Food and Agriculture Organization of the United Nations (FAO) pays tribute to precious resource essential for life; WATER.
Water is life, as the motto of this year´s celebration says..
It is a driving force for people, economy and nature and is the lifeblood of food. Food security and proper nutrition are terms that are intrinsically linked to ecosystmes, where without water there is no life, no fundamental functions and no productivity-crucial aspects of food systems.
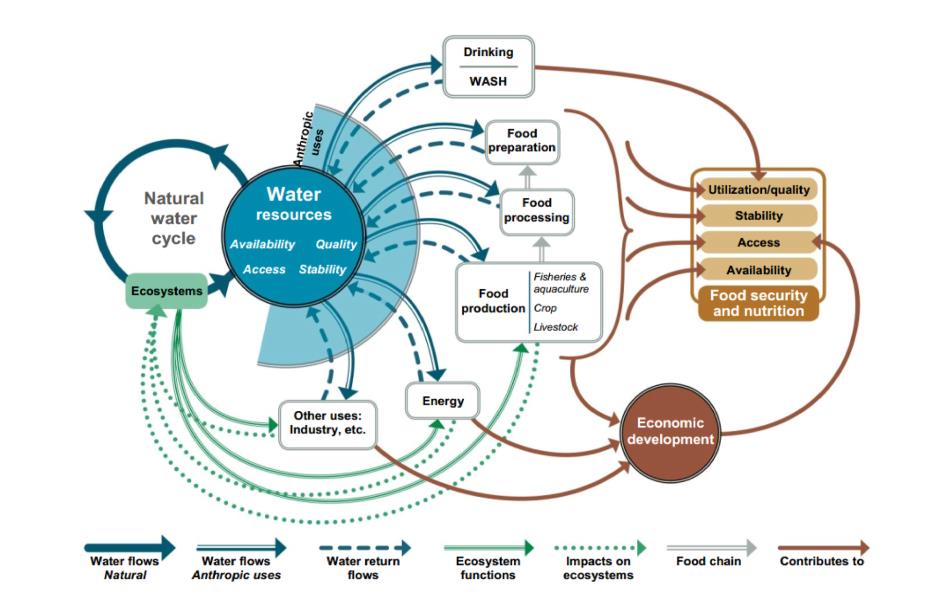
Water and food systems are profoundly linked through activities related to food production, processing, distribution, preparation and consumption within a broad and complex socio-economic, political and environmental context.
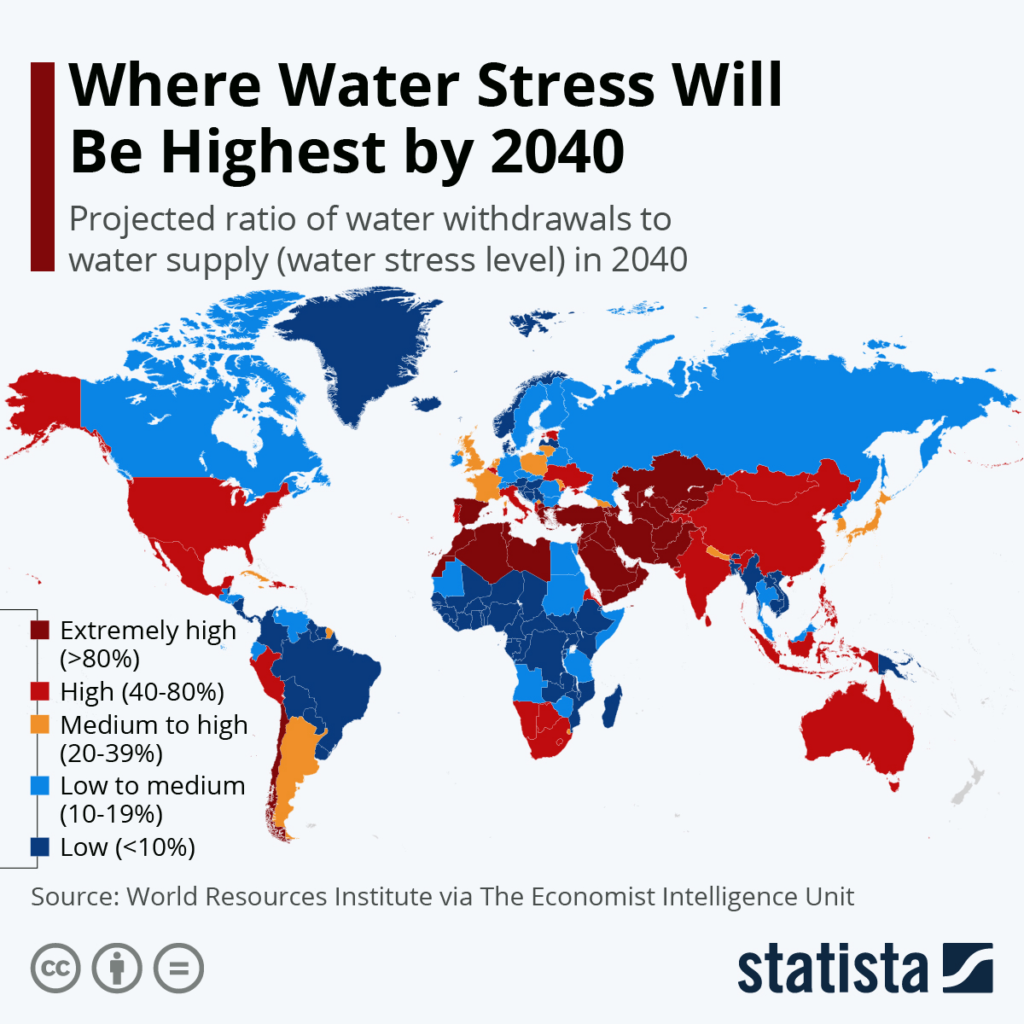
Food we eat and how ir is produced affects water. In fact, if we think about the food we eat, 95% of it is produced from a combination of water and ground. However, we must bear in mind that water suitable for drinking, agriculture and most industrial uses, known as freshwater, comprises only 2.5% of the total. Surprisingly, agricultural sector alone consumes more than 70% of the world´s available freshwater supply. And here comes some worrying news: due to population growth, urbanisation and economic development, the global demand for water for agriculture is expected to increase by 35% for 2050. This problematic is already a reality; according to FAO, 3.2 billion people live in agricultural areas with high or very high water scarcity.
#leavenoonebehinf; Water is life. Water nourishes. However, 2,400 million people live in water-stressed countries and aproximately, 10% of world´s population lives in high and critically stressed countries.
In the case of food from fisheries and aguaculture, whose importance for the diet is high due to its composition of essential nutrients such as omega-3 fatty acids, vitamins and minerals, the dependance on water is even greater. According to FAO data; at least 600 million people depend on aquatic food systems.
In addition to water quantity needs, water quality is also being affected by climate change and related diseases and food regions where extreme heat events occur.
Relationship between water and assurance of food and nourishing HLPE (2015)
These extreme weather events can affect water quality in several ways. On the one hand, rising temperatures can lead to the proliferation of water-and food-related diseases, as warm conditions favour the reproduction of dangerous micro-organisms. In addition, extreme weather events, such as droughts and floods, can contaminate drinking and agricultural water sources.
According to the Intergovernamental Panel on Climate Change (IPCC) report published last July, climate change is having a direct impact on decreasing food security and affecting water availability, hampering efforts to achieve the Sustainable Development Goals. In addition, oceans warming and acidification is having adverse effects on seafood production.
The same report again points to the need o to curb global warming. Limiting the growth of warming to 1.5ºC would reduce water stress and benefit this resource.
Therefore, climate change, water scarcity, the need to produce food for a growing population, degradation of water resources and associated ecosystems present significant challenges. In addition, other difficulties arise such as increasing competition for water use in different sectors and the lack of effective mechanisms to manage and protect the interests of those who are most vulnerable. There is an increasing urgency to find a sustainable way to manage water, which is referred to as “water security“. This would not only improve efficiency in food production and ease the tension in the conflict between growing demand for food and limited water resources, but also ensure access to food for all people. In this sense, water plays a key role in the process of improving our food systems.
There is a need to reduce water stress factors on food systems, as this has a strong negative impact on their functioning.
Water managament and governance is important not only in agriculture, but also in addressing water and food waste at all stages of the chain. The lack of relevant data between the different processes in the nexus highlights a lack of coordination between related actors and is a challenge that we need to address in a holistic manner.
The future of food is at stake, but there is no doubt that this necessary paradigm shift is intimately related with the future of people and the planet, and that it is a path for all of us towards a sustainable future, as our colleague Julia Pinedo explained in her post “Towards a food revolution”.
World Food Day is a day of celebration and a multitude of events and activities are organised around it. But, above all, it is an opportunity to reactivate our awareness of hunger and the planetary needs of ALL actos involved in ensuring a sustainable future of food for people and the planet.
Today´s agriculture is not sustainable and compromises the future if we don´t incorporate innovative axes and responsable solutions to ensure an adequate and sustainable food supply for generations to come. Our challenge is to produce more food and essential agricultural products with less water. This means creating and participating in integrated solutions for more efficient use and better conversation of existing water resources. Water challenges are pressing in all sectors, and achieving balance in water allocation requires collaboration between governments, farmers, researchers and civil society. To meet the water needs associated with food production, scientists and farmers are working together to develop sustainable water practices, such as building desalination facilities, creating reservoirs, applying water-saving technologies to reduce per capita water demand and improving agricultural efficiency.
Researchers seek new sustainable, social and economic solutions to address water challenges and meet our growing needs. This involves considering the complex interactions between resources and variables in realtion to water, energy, food and ecosystems.
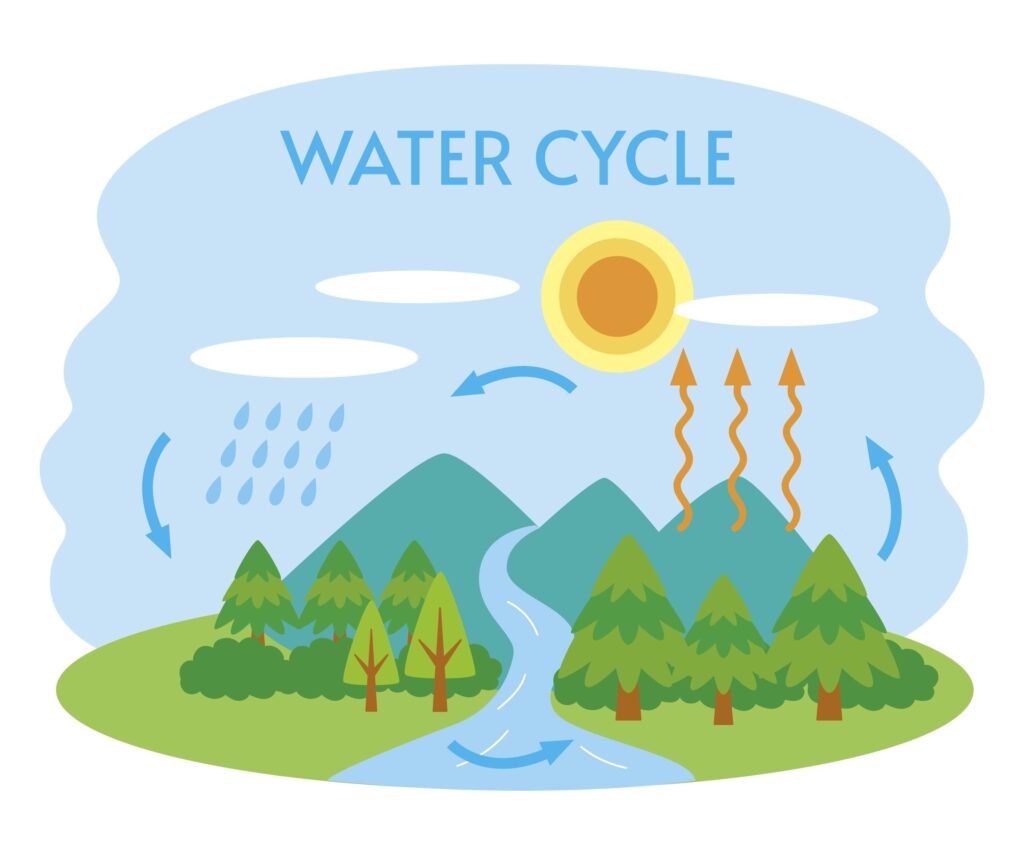
It is therefore essential that our actions are linked across the water cycle and food systems to improve both the water cycle itself and food securty in the context of healthy and balanced ecosystems.
The choice of the food we eat contributes to the way it is used. Actions such as eating local, seasonal and fresh food or minimising food waste contribute to reducing the impact on water stress.
Therefore, at CARTIF we work from a broad perspective of action on the challenges associated with this valuable resource. An example of this is our activity in the FUSILLI project in the transformation of food systems in a holistic way with the objective of improving their environmental sustainability through actions related to water management, the reduction of food waste, social inequality in its use and the evaluation of the associated uses.
Digital twin has become one of the main trends or “mantras” in relation to digitalisation. It is practically a synonym of a product, something that you can buy as a commodity for a company. At CARTIF, we believe that the digital twin concept is a synonym of the Industry 4.0 paradigm, a “revolutionary” approach that has transformed the way we conceive and manage industrial processes.
The term “digital twin” was created by John Vickers of NASA in 2010, but its predecessor, the product lifecycle, was introduced by Michael Grieves in 2002. This philosophy focused on managing a product throughout its life, from creation to its disposal. In essence, the physical product generates data that feeds a virtual space, providing essential information for decision-making and optimisation of the actual object.
A definition of a digital twin could be “An accurate and complete digital representation of physical objects, processes or systems with real-time data and physical characteristics, behaviours and relationships”
A key questions is why do we need Digital Twins? In other words, what is their utility? These accurate, real-time digital representations offer a number of key advantages:
Data compilation and analysis to obtain valuable information and generate knowledge, driving efficiency and informed decision-making.
Accurate and dynamic simulation of the behaviour of physical objects, enabling virtual testing and experimentation before implementing changes, like risky investments, in the real world.
Reducing costs and risks by minimisong risk and accelerating innovation in a wide range of sectors, from manufacturing to healthcare.
Real-time update on a ongoing basis as new data is collected from the physical object, ensuring its validity along its lifecycle.
Like previous industrial revolutions, Industry 4.0 has transformed the way we work. This fourth revolution focuses on the interconnection of systems and processes to achieve greater efficiency throughout the value chain. The factory is no longer an isolated entity, but a node in a global production network.
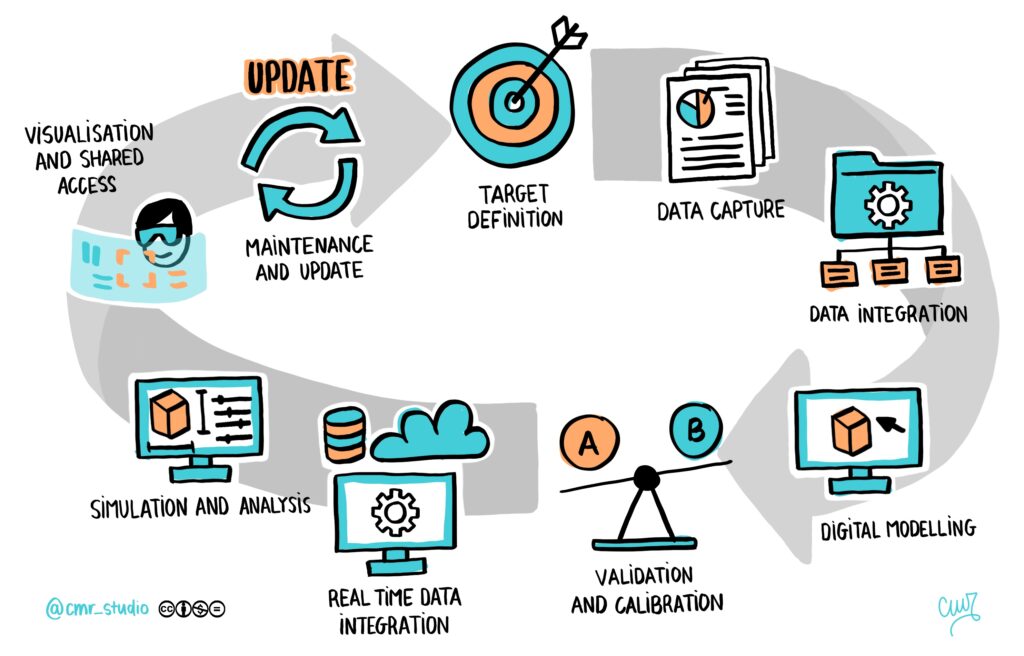
To create an effective Digital Twin, at CARTIF we follow a systematic recipe of 9 steps:
Objective definition: we identify the physical object, process or system we want to replicate and we clearly understand its purpose and objectives,
Data compilation: we gather all relevant data from the physical object using IoT sensors, historical records or other sources of information.
Data integration: we organise and combine the collected data in a suitable format for processing and analysis.
Modelling and construction: we use different simulation and modelling technologies to create and accurate digital representation of the physical object.
Validation and calibration: we verify and adjust the digital twin model using reference data and comparative tests with the real physical object.
Real-time integration: we establish a real-time connection between the digital twin and the IoT sensors of the physical object to link real-time data.
Analysis and simulation: we use the digital twin to make analysis, simulations and virtual tests of the physical object.
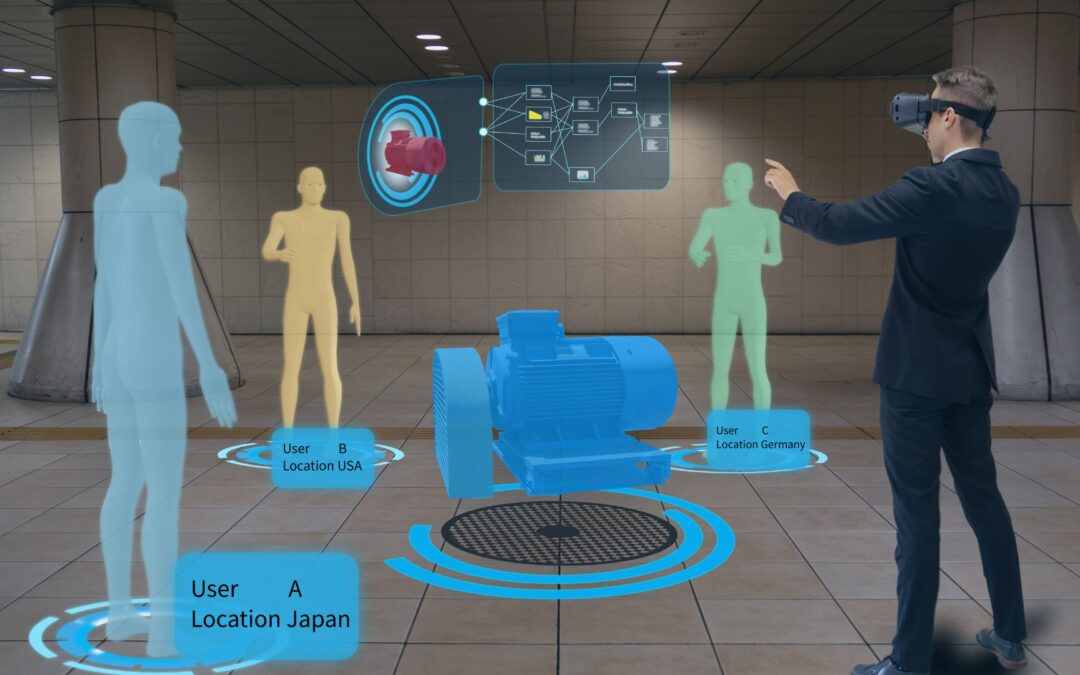
Visualisation and shared Acces: we provide visual interfaces and shared access tools for users to interact with the digital twin.
Maintenance and upgrade: we keep the digital twin up to date through real-time data collection, periodic calibration and incorporation of improvements and upgrades.
Just a previous industrial revolutions required enabling technologies, Industry 4.0 needs its own digital enablers. As we said at the beginning, we consider the digital twin a digitised form of the Industry 4.0 paradigm because digital enablers are fundamental to creating digital twins effectively. At CARTIF, we have accumulated almost 30 years of experience applying these technologies in various sectors, from industry to healthcare.
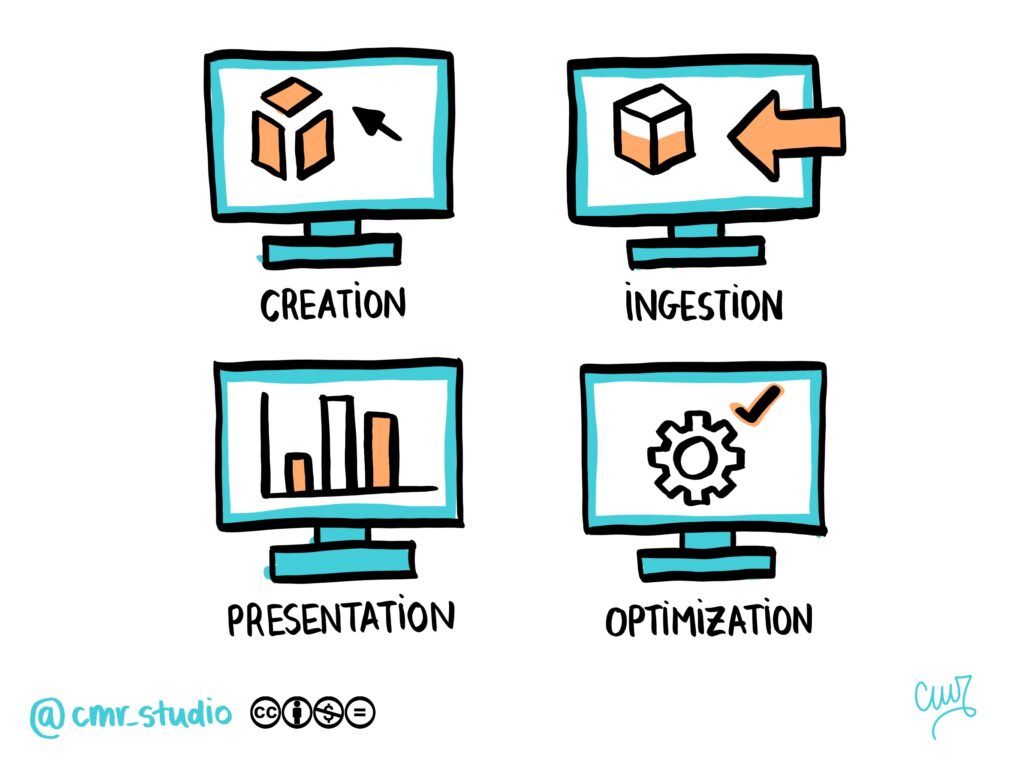
Digital enabling technologies fall into four main categories:
Creation Technologies: these technologies allow the creation of Digital Twins using physical equations, data, 3D modelling or discrete events.
Optimisation: optimisation is achieved through methods such as linear or non-linear programming, simulations, AI algorithms and heuristic approaches.
Presentation: the information generated can be presented through commercial solutions, open source tools such as Grafana or Apache superset ot even augmented reality visualisations.
Despite current progress, the challenge of keeping Digital Twins up to date remains an area of ongoing development. Automatic updating to reflect reality is a goal that requires significant investment in research and development.
In short, Digital Twins are the heart of Industry 4.0, boosting efficiency and informed decision-making. At CARTIF, we are committed to continuing to lead the way in this exciting field, helping diverse industries embrace the digital future.
When we think in agriculture, we often focus on the development of the plant, but we rarely consider the importance of proper management of the soil in which crops are grown. Soil is a vital resource that sustains our lives and provides the food that is indispensable for humanity, and its health is essential for sustainable agriculture and food security.
At first glance, soil may appear lifeless, but in reality, it is teeming with microscopic life. Healthy soils harbour a wide variety of microorganisms, including bacteria, fungi, protozoa, nematodes, etc. These organisms, which often go unnoticed, play an essential role in the functioning of terrestrial ecosystems.
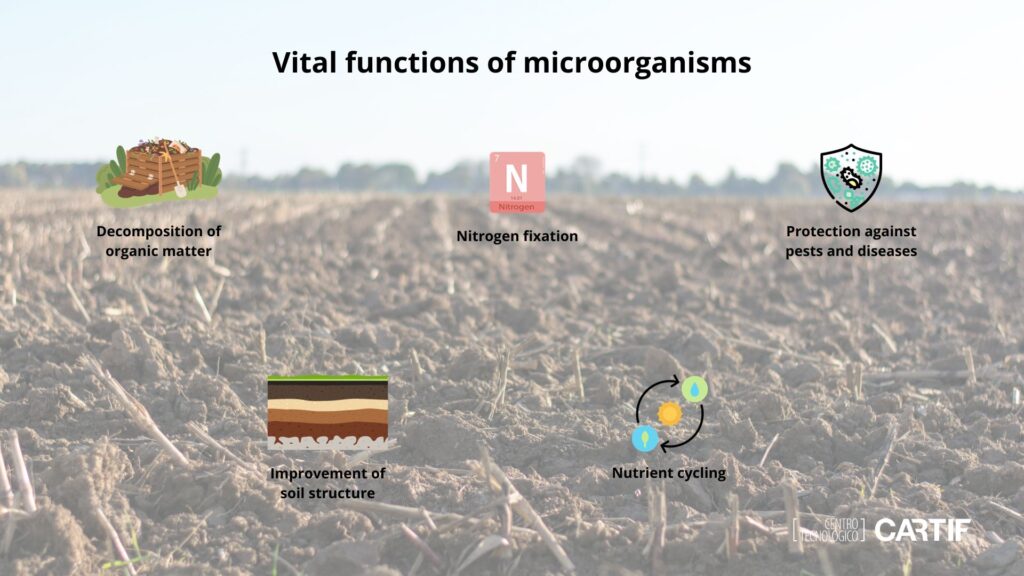
Among the soil-dwelling microorganisms, many are beneficial to plant health soil quality in general. These microorganisms perform a number of vital functions:
1. Decomposition of organic matter: microorganisms break down organic matter in the soil, such as fallen leaves and plant debris. This action releases essential nutrients that can be absorbed by plants to support their growth.
2. Nitrogen fixation: nitrogen is one of the most important nutrients for plant growth. Some bacteria have the ability to fix atmospheric nitrogen in a form that plants can metabolise.
3. Protection against pests and diseases: some microorganisms act as biological control agents, helping to prevent plant diseases by competing with pathogens or producing antimicrobial compounds.
4. Improvement of soil structure: other microorganisms, such as bacteria or fungi, generate soil aggregates that improve soil structure, porosity and water holding capacity.
5. Nutrient cycling: they participate in the decomposition and release of essential nutrients, such as phosphorus, potassium and various micronutrients (zinc, iron, copper, calcium), which are essential for plant growth.
Unfortunately, modern agriculture has engaged in practices that often damage the diversity and population of beneficial microorganisms in the soil. Excessive use of chemical fertilisers and pesticides, intensive tillage and lack of crop rotation are practices that can damage or unbalance the microbial ecosystem present in the soil.
For example, chemical fertilisers may provide nutrients to plants, but they can also lead to soil acidifcation and negatively affect beneficial microorganisms. Similarly, pesticides intended to kill pests can negatively affect other microorganisms in the soil, which can trigger a cycle of dependence on agricultural chemicals.
Fortunately, there are agricultural practices that can promote soil health and the abundance of micro-organisms that play a positive role in plant development:
Organic farming
Organic farming avoids excessive use of chemical pesticides and fertilisers, which preserves the microbial ecology of the soil.
Crop rotation
Changing crops season after season encourages microbial diversity and avoids the build-up of specific pathogens.
Use of cover crops
Maintaining a vegetative cover on the soil throughout the year helps to maintain microbial activity and prevent erosion.
Composting
Adding organic compost to the soil enriches the microbial population and provides nutrients in a balanced way.
Reduced tillage
Minimising soil tillage reduces the disruption of microorganisms in their natural environment.
Use of green manures
Planting green manure crops such as legumes can increase nitrogen fixation and enrich the soil in nutrients.
Soil health is fundamental to agricultural sustainability and global food supply. Beneficial microorganisms, working in symbiosis with plants, play an essential role in preserving that health. As a society, we must recognise the importance of
these tiny creatures and adopt practices that promote their thirving in our soils.
At CARTIF, we have the experience gained through the implementation of several projects related to the proper management of microbiology applied to agriculture and especially to soils, either in the form of biofertiliser (SUSTRATEC proejct) or in the form of biopesticide (SUPERA project).
Maintaining soil health is not only essential to ensure abundant and nutritous harvests, but also to preserve biodiversity and mitigate climate change. By protecting and nurturing life in the soil, we are investing in a healthier and more sustainable future for our planet and future generations. Let us care for the land that cares for us.
When we think of decarbonisation, the type of activity that comes to mind first and foremost is the implementation of large wind farms or solar farms that generate large amounts of clean energy. Or the much-needed refurbishment of buildings, which would drastically reduce overall energy demand due to our energy deficient building stock. However, in urban environments, another of the main sectors that generates emissions and where action can also be taken is mobility. Although depending on the source and the way emissions are accounted for the value may differ, it is estimated that between 25% and 35% of CO2 emissions in a city are due to mobility-related aspects.
The city where most of us who work at CARTIF technology centre live, Valladolid, is one of the cities participating in the European Mission on Climate Neutral and Smart Cities (Mission of Cities) promoted by the European Comission. Valladolid is one of the 112 cities from all over Europe and several associated states that were selected by the European Commission. In Spain, it is joined by Madrid, Barcelona, Valencia, Seville, Zaragoza and Vitoria. In accordance with the objectives of the cities mission, these 112 cities have voluntarily committed to becoming climate neutral by 2030. This is 20 ahead of the climate neutrality target set globally for the entire European continent in 2050. This requires encouraging the implementation of sustainable solutions and advanced technologies, also in areas such as sustainable mobility.
However, cities cannot walk this path of decarbonisation alone. This is why they are seeking the complicity not only of citizens to act individually, but also of companies to implement actions that will have a greater impact. At this point it is necessary to remember that climate neutrality is achieved by combining two type of actions: those that directly reduce emissions and those that capture those emissions and either regenerate the oxygen we need to live or use the CO2 as raw material in production processes. Both types of actions are necessary. It is their optimal combination that will achieve neutrality.
In this blog, CARTIF proposes a concrete action that contributes significantly to achieving these ambitious decarbonisation objectives. This action is the implementation and deployment of sustainable mobily plans for companies (PMS). These plans, complementary to the city´s own sustainable mobility plans, seek to reduce greenhouse gas emissions produced by a company´s means of transport, which are one of the main sources of pollution in cities, especially in emission areas 1 and 2. These emission areas consist of the direct and indirect emissions of companies produced, in this case, by the transport of employees, materials and products and by the type of fuel used in each case.
Companies, through the deployment of sustainable mobility plans that promote a change in the way their employees commute, for example, can contribute to reducing the overall volume of emissions in cities. In order for these plans to be accepted and therefore fully deployed, they must not only be agreed upon, but also co-developed between management, employees and all other necessary stakeholders. It is therefore highly advisable to develop them through co-creation strategies, which allow the effective participation of all these groups, so that they become direct participants in the change. Support (probably indirect) for the implementation of more sustainable and less polluting modes of transport, such as collective transport (ideally without emissions), cycling, walking and electric vehicles are clear measures, but other indirect strategies such as the promotion of teleworking, improved shifts, more effective routes, the promotion of shared mobility, the implementation of canteen areas or the installation of electric charging points are another series of measures that can be proposed. No journey generates fewer emissions than the unnecessary journey that is avoided.
In addition, the municipalities themselves must participate by committing to improving the necessary infrastructure to carry them out, such as connected and safe cycle lanes, improved urban transport, etc. It is also key to mention the indirect benefits that these types of activities can generate. In general, sustainable mobility plans seek to reduce mobility-related greenhouse gas emissions, but this benefit in turn will reduce energy dependence on fossil fuels, improve the global energy system and its stability, which will contribute to mitigating the effects of climate change and, more importantly, to improving air quality in cities and the health of the people who live in them.