Any processing plant – continuous, batch, hybrid – can improve its economic, safety and environmental indicators in two ways: improving its processing equipment or improving the control of those equipments.
The improvement of processing equipment is usually a task that requires large investments, since it almost always involves the acquisition of new processing equipment or in the best case requires expensive remodeling.
On the contrary, these performance indicators can be substantially improved through control, without, in the majority of cases, any investment in new technical means of instrumentation and control. This is because in practically all cases there is a wide margin to improve the performance indicators of a processing plant through its regulation.
The origin of this margin of improvement is multiple. The most common causes are: the control system is not well designed or tuned; due to ignorance or haste, all the benefits of the available control system are not used; the automaton programmer or the process engineer are not control experts; the dynamics of the processes under automatic regulation are not known with the required depth; the design of the plant has not been made under the integrated design approach.
Are also diverse and numerous actions that can be implemented to improve the performance of control loops without any investment and that we will review in next posts, such as: improve the tuning of the regulator, redesign the controller, implement anticipatory compensation of disturbances, enhance the tuning of cascade regulation loops, redesigning or re tuning the level controllers of the buffer tanks if necessary, using a control algorithm advanced available or supportable by the controller instrument, reducing couplings between loops, making a better assembly of the measuring probe, etc.
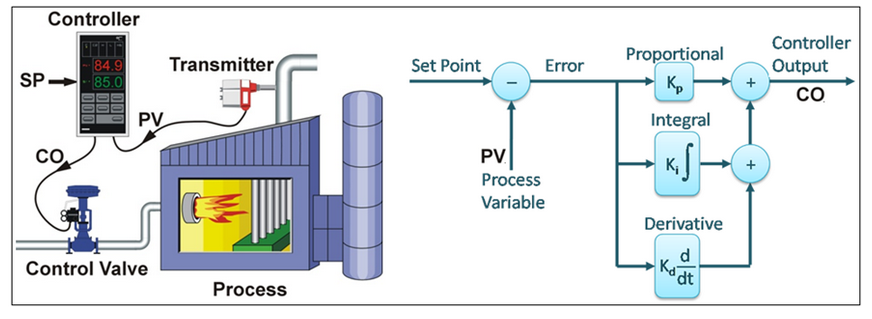
In its vast majority, the processing plants are automated under control structures (basic control, cascade control, split range control, selective control, coupled loops, etc.) based on the universal PID controller, in all its particularizations (P, PI, PD, PID, PI_D, etc.).
Despite its longevity and the development of multiple advanced control techniques, PID control maintains an overwhelming presence in the process industry.
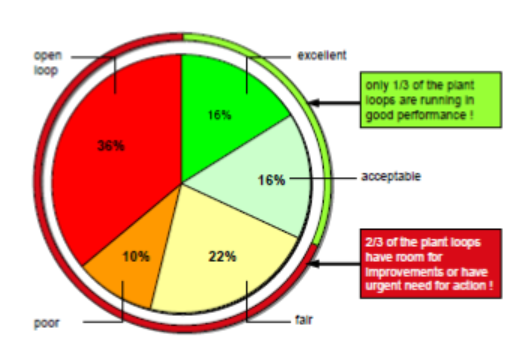
Its extensive use in the industry is such that all the surveys known by the author conclude unanimously, in which more than 95% of the existing control loops are of the PID type. However, also many surveys conclude that a high percentage of the loops with PID control in the world, are operated in manual mode, while another similar percentage operates defectively. For example, as shown in the following figure, in [1] it is reported that only 16% of the PID regulation loops are optimally tuned and their performance is therefore excellent.
There is no doubt that in most cases, the incorrect or poor tuning of the controller can be the cause of the poor performance of the control loop or its irregularities in the operation.
However, it should not be forgotten that automatic regulation systems are holistic systems, and as such they must be analyzed as a whole and not only through the parts that compose them. That is why it is necessary to review the other components of the loop before deciding what action should be exercised on said loop.
Hence, the procedure of action in all cases, must begin with a field review of all the components of the loop (controller, process, actuator, measurer and communication channels), as well as an analysis of the possibility of coupling with other process loops.
The result of this first phase will determine what concrete action corresponds to perform to solve the poor performance of the automatic regulation loop.
CARTIF offers this service to optimize the performance of the regulation systems of processing plants. The optimization reduces the oscillations and the variability of the production plant, making the regulation system more accurate, faster, more stable and safer, and in this way improving its efficiency, safety, environmental impact and profitability.
In next post, the execution procedure will be described for each of the possible actions, starting with the simplest one, the re-tuning of the controller.
A little more than a year ago, in another post of this blog, our colleague Sergio Saludes already commented what is deep learning and detailed several of its applications (such as the victory of a machine based on these networks over the world champion of Go, considered the most complex game in the world).
Well, in these 16 months (a whole world in this topic) there has been a great progress in terms of the number of applications and the quality of the results obtained.
Considering, for example, the field of medicine, it has to be said that diagnostic toolsbased on deep learning are increasingly used, achieving in some cases higher success rates than human specialists. In specific specialties such as radiology, these tools are proving to be a major revolution and in related industries such as pharmaceuticals have also been successfully applied.
Autonomous vehicle driving projects, so in vogue these days, mainly use tools based on deep learning to calculate many of the decisions to be made in each case. Regarding this issue, there is some concern about how these systems will decide what actions to take, especially when human lives are at stake and there is already a MIT webpage where the general public can collaborate in creating an “ethics” of the autonomous car. Actually, these devices can only decide what has previously been programmed (or trained) and there is certainly a long way to go before the machines can decide for themselves (in the conventional sense of “decide”, although this would lead to a much more complex debate on other issues such as singularity).
Regarding the Go program discussed above (which beat the world champion by 4 to 1), a new version (Alpha Go Zero) has been developed that has beaten by 100 to 0 to that previous version simply knowing the rules of the game and training against itself.
In other areas such as language translation, speech comprehension and voice synthesis have also advanced very noticeably and the use of personal assistants on the mobile phone is beginning to become widespread (if we overcome the natural rejection or embarrassment of “talking” with a machine).
All these computer developments are associated with a high computational cost, especially in relation to the necessary training of the neural networks used. In this respect, progress is being made on the two fronts involved: much faster and more powerful hardware and more evolved and optimized algorithms.
It seems that deep learning is the holy grail of artificial intelligence in view of the advances made in this field. This may not be the case and we are simply looking at one more new tool, but theres is no doubt that is an extremely powerful and versatile tool that will give rise to new and promising developments in many applications related to artificial intelligence.
And of course there are many voices that warn of the potential dangers of this type of intelligent systems. The truth is that it never hurts to prevent the potential risks of any technology, although, as Alan Winfield says, it’s not just artificial intelligence that should be feared, but artificial stupidity. Since, as always happens in these cases, the danger of any technology is in the misuse that can be given and not in the technology itself. Faced with this challenge, what we must do is promote mechanisms that regulate any unethical use of these new technologies.
We are really only facing the beginning of another golden era of artificial intelligence, as there have been several before, although this time it does seem to be the definitive one. We don’t know where this stage will take us, but trusting that we will be able to take advantage of the possibilities offered to us, we must be optimistic.
The day all of us enjoy electricity dynamic prices thanks to the smart grid, we will see how the washing machine and other home appliances come into life. And they will do it to allow us to pay less for the energy they need to do their duties. This will be one of the advantages of dynamic prices that are those that change along the day to encourage us to use energy when there is a surplus and to dissuade us of using energy when there is a shortage.
To have a better understanding of how dynamic prices will impact on our lives, there has been a research project conducted in Belgium that involved 250 families equipped with smart home appliances, namely washing machines, tumble dryers, dishwashers, water heaters and electric car chargers. Smart home appliances are those that receive information about electricity rates and that can make decisions about their own operation. For the purposes of the project, the day was divided into six time slots with different electricity prices according to the energy market. The families involved in the experiment were divided into two groups.
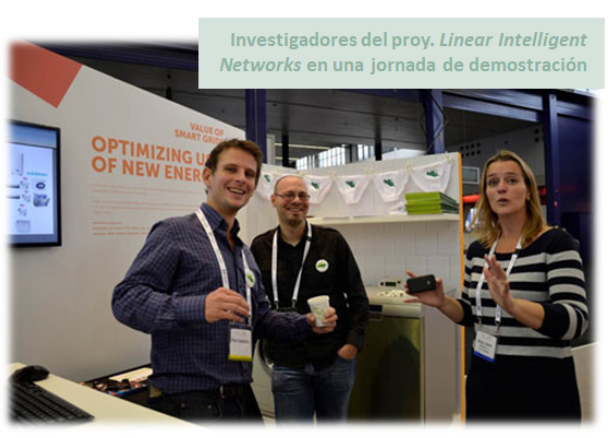
Researchers of Liner Intelligent Networks project in a demostration
The first group got information about next day electricity prices through an app installed in a mobile device. Then, they have to plan the use of the appliance for the next day considering the prices and their needs.
The second group have appliances that reacted to the prices in an automated fashion while preserving the owners’ utility. To understand how it worked, imagine a family who wants to have their dishes ready for dinner at 6PM. At 8AM, when they left home to work, they switch on the washing machine and indicate the hour the dishes must be ready. In the case the washing machine needs two hour to complete the work, the machine knows it could start to work at some moment between 8AM and 4PM and it chooses the moment in the time slot with lower price. In the case the energy were cheaper after 4PM, the washing machine started to work at 4PM to assure the dishes were clean and dry at the moment the owners needed them. Other appliances, like the water heater, just chose the time slots with cheaper energy to keep water at desired temperature.
The customers in the first group found the system annoying and they left the experiment. However, those in the second group found the method did not affect their comfort and that their appliances preferred the night to work. Besides this, there was a reduction in the electricity bill: 20% for dishwashers, 10% for washing machines and tumble dryers, and 5% for water heaters.
One of the findings of the project was that customers do not like to be on the lookout of the next day prices. This result is quite surprising if we consider the success of the Opower company, that according to them they were capable of reducing the bill, energy use and CO2 emissions using a customer information system quite similar to the one used by the Belgians with the first group, the one based on getting information the day before to make decisions in advance. But today Opower is in the Oracle realm, maybe because this big company was more interested in the data and knowledge Opower had about how people demand energy than in the possible benefits for environment, electric grid and customers’ wallets. Anyway, it seems the original’s Opower spirit remains alive.
The smart grid will make possible our washing machines will be connected to the power company through Internet soon and it will be in charge of making decisions about when to work in order to reduce our electricity bill. After that, if the washing machine makers were able to design a machine capable of ironing the clothes our happiness would be complete.
Traditionally, factors that were taken into account in manufacturing processes were economic, management, production, etc. However, this situation has changed in recent years. Energy efficiency and sustainable management are fundamental aspects that many companies have incorporated in their processes. Aware of that reality, CARTIF is accompanying the companies to incorporate in them the “Factories of Future” concept. An example of work done is the REEMAIN project.
REEMAIN moves toward zero carbon manufacturing and Energy Efficiency 2.0 through the intelligent use of renewable energy technologies and resource saving strategies that consider energy purchase, generation, conversion, distribution, utilization, control, storage, re-use in a holistic and integrated way.
In addition to that, REEMAIN project has provided us with the opportunity to expand our knowledge and experience in the Resource and Energy Efficient Manufacturing world. During the demonstration actions at the factories, the team has experimented energy and materials saving technologies and process and, of course, tested their effectiveness.
As the project comes to an end, we have produced a Best Practices Book as a way of sharing our experience with other professionals in the material and energy efficiency manufacturing domain.
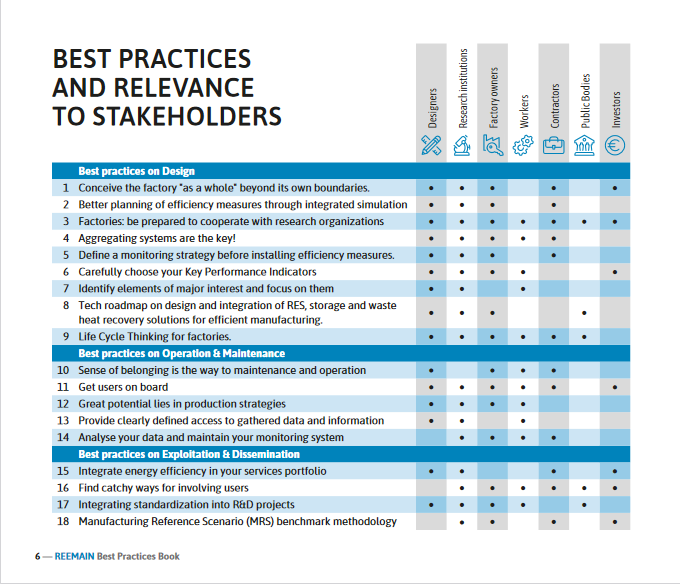
The REEMAIN Best Practice Book summarises the key findings from our experience of over four years working on the project and are recommendations we make to the overall community involved in this kind of projects (designers, research institutions, factory owners, workers, contractors, public bodies, investors, etc.), in order to provide a help if some of them decide to get involve in an efficiency improvement project within a factory.
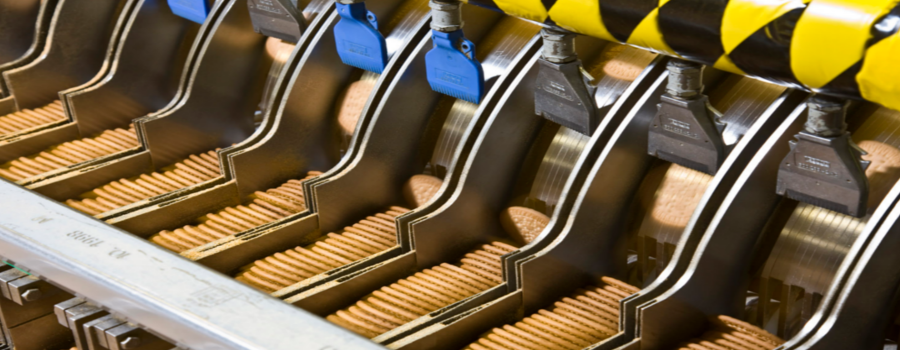
18 Best Practices are featured. They were based on our experience while searching and testing efficiency measures in our three demo factories: GULLON (Biscuit), BOSSA (Textile) and SCM (Iron & Steel). Three main thematic areas had been identified: Best practices on “design”, best practices on “Operation and maintenance” and “Exploitation & Dissemination”.
Each of them is presented in a short and visual way. They are composed of: title, description (being itself a recommendation), stakeholders, replicability, practical guidelines and things to avoid, impact rating, and finally the REEMAIN practical experience.
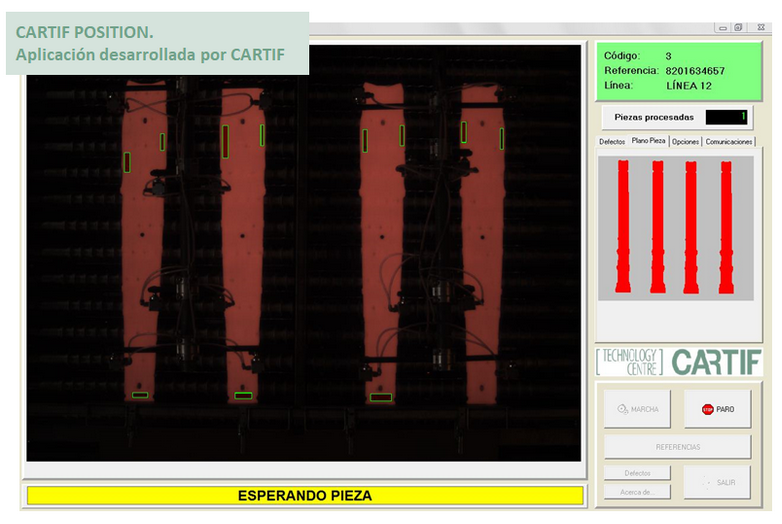
With this post, I would like to try to show a very clear example where, the intelligent use of a suitable artificial vision system can solve a major problem in a production line at a reasonable price.
The body of our vehicle consists of a multitude of metallic pieces, each with its own requirement. The automotive industry manufactures these parts through a laminating sheet forming process called stamping. In this process a metal sheet is placed on a matrix, it is fixed and later, a punch pushes the sheet towards the matrix generating the desired cavity.
Depending on the temperature of the steel blanks two types of stamping are defined: cold stamping and hot stamping. In this case, we will focus on the hot stamping, which is applied mainly in elements of high structural requirement, such as reinforcements, pillars, etc.
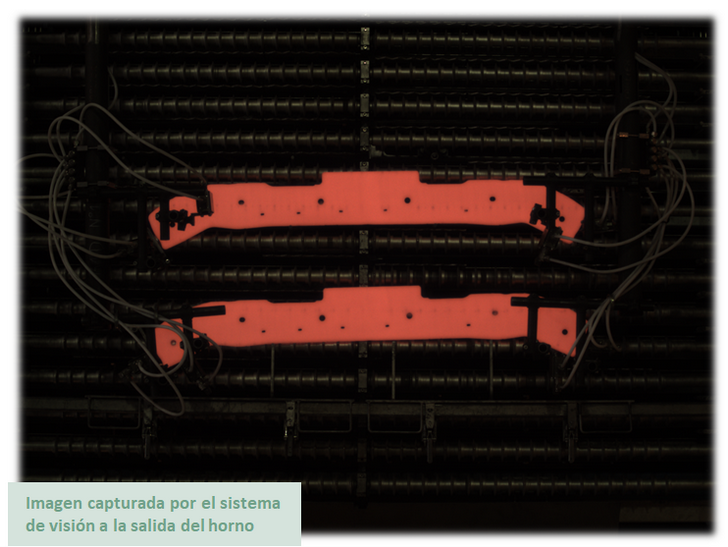
Image captured by the vision system at the exit of the oven
In this process the steel blanks is heated above the austenization temperature, obtaining a high ductility and then proceeding to a rapid cooling to achieve the martensitic hardening of the sheet. The pieces obtained reach high resistance, complex shapes are obtained and the effects of springback are reduced. This allows, among other things, to improve the passive safety of our cars and reduce their weight.
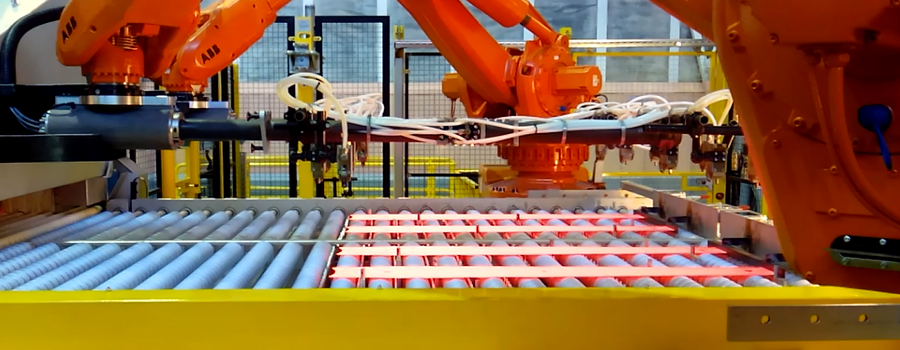
In this manufacturing process, the steel blanks leave the furnace at high speed, at a temperature around 900-950 ºC, they stop abruptly in a fixed position and, later, a robot collects them to introduce them in the press as quickly as possible , In order to avoid its cooling before the press stroke.
The problem arises from the difficulty of ensuring a fixed position with mechanical fasteners. This is due, among other things, to the speed of the line, the great variety of references, the high temperatures of the steel blanks (which cools very quickly at the point where there is a contact) and the internal characteristics of the furnace (which can measure up to 30m).
An incorrect position means that the robot fails to pick up the steel blanks, or worse, to pick it up incorrectly and place it incorrectly in the press, producing a wrong press stroke and stopping the line, together with a deterioration of the tools.
In this case, the artificial vision is presented as the best choice to indicate to the robot if the actual position of the steel blanks is correct. The most important task of the vision system will be to correctly segment the steel blanks into the image in order to accurately determine the position of the steel blanks.
CARTIF position. Application developed by CARTIF
A priori, given the intense infrared radiation emitted by the plates due to their high temperature, it seems that the easiest alternative to achieve this task is to use industrial infrared cameras. This solution presents two problems: the high cost of these equipments and the low resolution of the infrared sensors.
The working area in which the steel blanks are positioned is very wide, due to the size of the parts and because in many cases it is worked in batches, handling up to four units simultaneously. Given the low resolution of these sensors, it is necessary to use several cameras to increase the precision with which the position is defined.
From CARTIF we have been developing more economical solutions, using industrial cameras within the visible electromagnetic spectrum with a greater sensitivity in the infrared range. The resolution of these cameras is much higher than that of the infrared cameras which allows to increase the accuracy of the measurements.
This has allowed companies such as Renault to obtain a robust and configurable system that avoids undesirable stops of the line and extends the useful life of its tools, which leads to a considerable improvement in the production line.
Low cost alternative innovations. The barometer and how to think outside the box
I finished my previous post commenting how an ILM approach –to disaggregate energy consumption in a factory- can be an unbeatable challenge, financially, for those factories with highly distributed energy consumption.
The commercial market offers several alternatives for industrial measurement systems, designed by the main equipment manufacturers such as SIEMENS, ABB, SCHNEIDER, … capable of providing a hyper-exhaustive follow-up (several measures per second) of the energy consumptions of the different elements in a production chain. However, the cost of the necessary hardware, -the required computer and communications installation-, or the cost of the software licenses make such systems quite expensive. The consequence is that nowadays, they keep being a luxury only available to the large multinationals that also have several similar factories in different locations and, therefore a better purchase negotiation capacity and an easy and high internal replicability. In addition, its production processes are highly automated and computerized through the latest generation MES (Manufacturing Execution System) systems. They already have the necessary IT and communications infrastructure. They just lack the investment in hardware and the “upgrade” of their software licenses.
For other small and medium-sized factories, these solutions can mean “using a sledgehammer to crack a nut”, so that the investment in monitoring will never be profitable (in terms of produced savings). However, these types of factories are increasing their interest in optimizing their energy costs, but employing a reasonable economic investment more appropriate to their billing volumes.
Every science student will have heard the supposed anecdote of Niels Bohr and the barometer in one of its many versions. Although the anecdote of Bohr and the barometer is not real but invented, the moral of trying to think differently when solving a possible problem is more relevant than ever. The difference is that we now call it “thinking outside the box“. The question now is not how to measure the height of a building with the help of a barometer, but, how the measurement and monitoringof energy consumption of a factory could be developed without spending the whole sum of the factory one-year investment budget ?
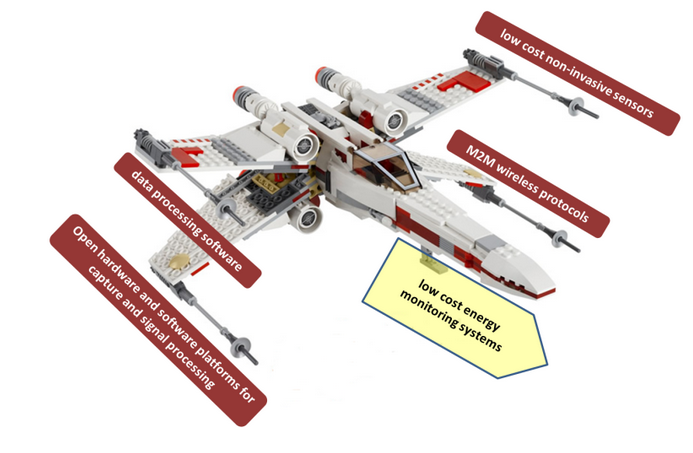
The answer, as in the problem of the barometer, is not unique, as it will depend on each particular factory. Fortunately, the IOT revolution is producing economies of scale in some of the necessary components. Continuing with the ‘Star Wars’ tribute, the low cost monitoring energy consumption systems can be compared to an X-wing starfighter formed by the following four wings:
The lower cost of electronics, which is allowing the development of new low-cost non-invasive sensors such as Hall effect-based electric current sensors, ultrasonic flow sensors, or infrared temperature sensors.
The open source hardware-software platforms for signals capturing and processing through low cost devices like Arduino, Raspberry Pi and others.
The emergence of new wireless communication protocols oriented to the M2M (Machine To Machine) communication with characteristics of low bandwidth and energy consumption and high resistance to the interferences, like Zigbee, BT LE or Wi-Fi HaLow.
Software systems for storage and processing all the recorded data, for example the database systems, the multiple indicator reports automatic calculation tools and the use of displays showing the current values of the most important parameters. Both, residents on physical servers located on the factory intranet, or virtual cloud rented servers.
These new technologies are not yet mature and obviously the industry can be very reluctant to use them. If there is something that scares a production or maintenance manager those are the experimental systems that have not been tested previously for years. However, it is necessary to remember that we are not talking about modifying the control systems of processes and machines, but about deploying a parallel system throughout the factory that allows the monitoring and records the energy consumption of the main elements and production systems. We are talking about the detection of possible energy inefficiencies. We are talking about its correction and the corresponding economic savings. And we are talking about doing so with a reasonable investment cost, that is, that an SME can afford it.


