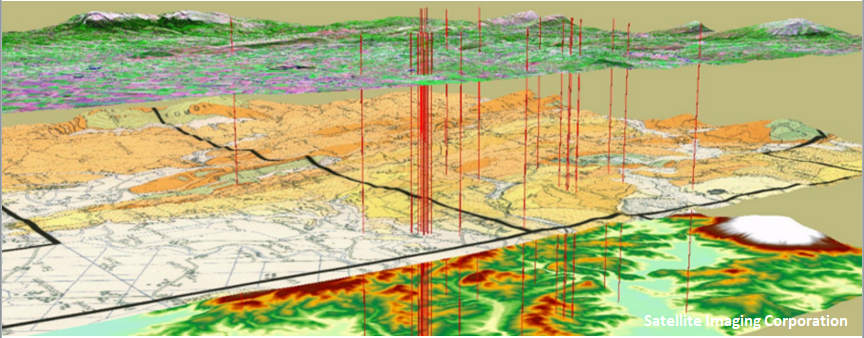
Even though the term Geographic Information System (GIS) is well-known, it is possible that many of you don’t know what applications it might have or its relevance in the energy field. Put in short, GIS (or SIG, in Spanish) are all software in charge of the treatment of data containing some geometric characteristic and that can be reflected on a map in their precise position. These data can be 2D or 2,5D* (described with points, lines and polygons), 3D, or cloud points (LIDAR data). Moreover, these geographic data are normally associated to attribute tables, where information on them is introduced. For example, we can have a map with the provinces in Spain and in the attribute table have assigned to each polygon representing a province their demographic data, economic data, etc.
One of the most remarkable aspects of these systems is not only being able to visualize elements in their precise geographic location, but also that these layers of information can be overlapped allowing to visualize at the same time geographical elements displaying different realities. This is quite straightforward and we are very used to seeing it in phone apps, for example GPS apps, where we can observe a base map (a city map or a satellite image) and several layers that are placed on top of it, such as the name of the streets, stores, etc.
A part from being able to use these systems in order to guide ourselves in cities (which is no small thing) the potential of these systems lies in being able to perform spatial analysis, which would be impossible with other means. This way, we could have answers to questions like the following:
- What would be the floodable areas by this river?
- If an incident occurs in this area, which are the closest hospitals? What would be the best route for ambulances with respect to distance? And with respect to time?
- Where should the stops of this bus line be placed in order for them to be spaced at a maximum of 600 meters? Which areas in the city would benefit from it considering a radius from the bus stop of 10 minutes walking?
- How have forest areas been modified in a concrete zone? Is there risk of desertification?
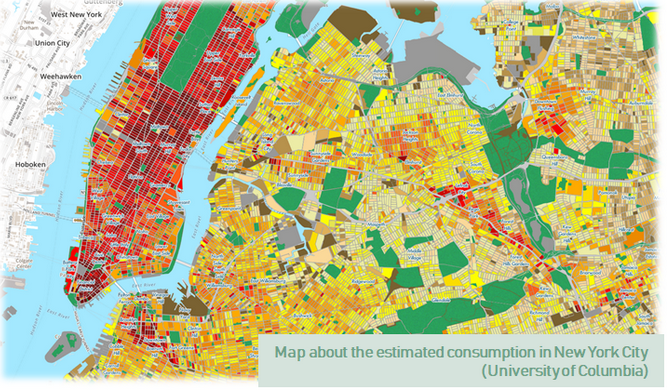
These only represent a small sample of the reach of GIS, which proves extremely useful to carry out planning activities in a wide range of fields (risks and accidents, traffic management, transport networks, environmental impact assessment, agriculture, natural risk assessment…). But focusing on the energy field, GIS have also a great potential for the support in the development of energy plans, compliance with energy directives and result monitoring. For example, we could get to know which areas are in need to perform an energy retrofit. To this respect it is worth mentioning as an example the map developed by the University of Columbia on the estimated consumption in New York City.
Additionally, several different scenarios can be evaluated where the effectiveness of the different actions is measures or if a determined area can be supplied by other type of energy source (renewable, for example). Calculating these indicators it can be checked if the objectives imposed in a determined directive are complied with or not.
In CARTIF, and in particular in the Energy Division, GIS are exploited and their applications to support to the compliance with the European Directives in the energy field, more specifically to the Directive package “Clean Energy for All Europeans”. Moreover, special attention is paid to the study of the data structure and the standards that should be followed to assure its interoperability. In this sense, it is worth highlighting the open standards proposed by the Open Geospatial Consortium (OGC), and also the INSPIRE Directive, which defines the infrastructure for the spatial information in Europe and which will be applicable in 2020.
This latter aims at harmonising and offering geospatial information in Europe in a range of 34 themes. Even though none of them is strictly related to energy (these aspects can be assigned to build elements, such as buildings (BU)), the study of the most relevant energy attributes is crucial in this moment prior to the implementation of the INSPIRE Directive, as it has been manifested by the European Commission when defining a project that studies the potential of the Directive in the energy field: the “Energy Pilot”. CARTIF, aiming for innovation and the alignment with the EU collaborates in this project interacting with one of the reference centres of the Commission: the Joint Research Centre in Ispra.
*Note for the curious: for example a cube can be considered 2,5D when it is defined instead of with eight vertexes with x, y and z values, it is defined only with the four above, since those contain the “z” value in contrast to the four lower vertexes, where this value would be 0.

MSc Architecture. Researcher in the Energy Department, within the Energy Efficiency and Energy Climate Policiy areas. RethinkAction project coordinator. Her lines of research focus on the generation of decision-making tools at different scales that facilitate the eneregy transition, and mitigation and adaptation to climate change.
- COP27: why decisions on climate change made at this summit affect you? - 2 December 2022
- Geographic Information Systems and their application in the energy field - 26 January 2018
- Are energy performance certificates really useful? - 26 April 2016