It is curious how, at the moment we find ourselves, our sense of time has been so disrupted due to the confinement to which the entire population is subjected.
Humanity has developed all kinds of tools that allow us to feel we have everything under control. That is why the most common way to corroborate the passage of time is the use of the clock. But right now, is the clock really that reliable? And, if so, Why does time seem to pass so slowly? What if the clock is just another of the illusions invented by humanity to appear to control something as intangible as time?
Time is much more than a number, time must be lived and felt in order to experience its passage. Our perception of time is very subjective and maintains a close relationship with the emotional situation that we now endure. Most of us have noticed at some point in our lives how the speed of time is a variable factor linked to our emotions. In comfortable situations the time flies by, when we do some pleasant or new activity, when we are motivated or when we are at the top of tasks. The opposite happens when we are having a bad time, when we are impatient or in any uncomfortable situation, such as being in danger or when we are bored. Also, special mention to the slowness of the time when we are paying attention to it, that is, when we keep an eye on the passage of the minutes, for example, when doing sports or going to the gym.
The previous observations lead us to understand the importance of how the subjective assessment we make of the perception of time influences this in our lives. Ramón Bayés (El reloj emocional; Barcelona: Alienta Ed. 2007), encourages us to examine the elements that influence this perception, as it is important for our mental health, ‘managing internal time, that is, the time we subjectively appreciate, it is very important to achieve well-being’. We are in constant war with time, sometimes wishing it would go faster and sometimes slower. What we have to ask ourselves in these cases is what subjective factors motivate us to have an expectation about how time should pass. That is, asking ourselves what emotions lead us to think that time is passing very slowly or very fast, and once identified, focus on these because it is what we have, time will never be in our hands. In this way we also help control the emotional alarms of the brain that can generate a state of stress that can seriously harm our health. Remember that stress releases hormones such as cortisol and one of the consequences of this is the depression of the immune system, a system that today more than ever is convenient for us to keep it as healthy as possible.
April 7 is World Health Day. It is paradoxical that this year we will celebrate it confined due to a global pandemic. However, although #Istayhome, life goes on and we cannot let our guard down when it comes to health.
Each of us associates the fact of being at home with different habits: some to tranquillity and rest, others to domestic tasks, others to family. Whatever your situation, there are no excuses to do it in a healthy and active way.
Let’s put ourselves in situation with some data from the 2019 health profile in Spain published by the OECD (Organization for Economic Cooperation and Development):
Spain is the EU country with the highest life expectancy: 83.4 years in 2017, which is 2.5 years above the EU average. Spaniards today can expect to live an additional 21.5 years after reaching the age of 65, 1.5 years more than the EU average. This increase in life expectancy was mainly caused by a considerable reduction in mortality rates from cardiovascular diseases, although mortality from Alzheimer’s disease increased as a consequence of the increase in life expectancy.
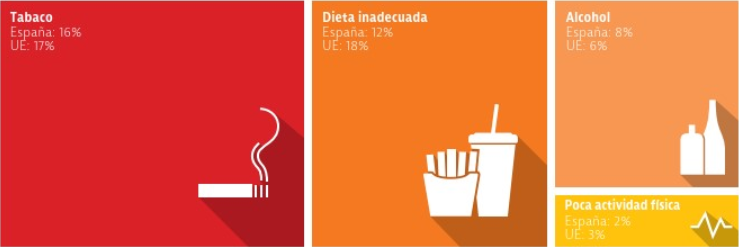
Spain has some of the lowest mortality rates from preventable and treatable causes, indicating that public health and healthcare interventions are, in some cases, effective. However, much remains to be done as estimates suggest that more than a third of deaths in Spain can be attributed to risk factors associated with behavioural habits, including tobacco use, poor diet, alcohol consumption and sedentary lifestyle (see figure).
Figure: Percentages of deaths in Spain and in the EU attributed to behavioural risk factors. Source: IHME (2018), Global Health Data Exchange (estimates correspond to 2017)
In the case of smoking, an anti-smoking law was adopted in 2005 and was strengthened in 2010. The 2010 law strengthened the rules on the retail and advertising of tobacco products; increased protection for minors and non-smokers by expanding smoke-free zones to all public places; and promoted the application of smoking cessation programs, especially in primary care. At the same time, taxes on cigarettes were increased, by 3% per pack of cigarettes in 2013 and by 2.5% more in 2017, along with a 6.8% increase in taxes on rolling tobacco. All these measures have contributed to the fact that smoking rates have decreased in the last fifteen years. However, more than one in five Spanish adults (22%) continued to smoke daily in 2017, representing a higher proportion than the EU average (19%).
Regarding overweight and obesity, the data is even more alarming. In 2005, the NAOS Strategy, managed by the Spanish Agency for Consumption, Food Safety and Nutrition, aimed to curb the increase in obesity in the Spanish population. This was reinforced by the Food Safety and Nutrition Law adopted in 2011, also with the aim of reducing overweight and obesity in children, prohibiting foods and beverages with a high content of saturated fatty acids, salt and sugar in schools and, more broadly, tightening the regulations on children’s menus. Recently, work has been carried out to establish a set of indicators that allow evaluating progress in their application and for the execution of health promotion activities in the area of nutrition, physical activity and obesity prevention (AECOSAN, 2019). In 2018, the Ministry of Health, Consumption and Social Welfare announced new measures to reinforce the NAOS Strategy and, among them, an initiative on a new labelling on the front of packages using the Nutriscore model. Using an easy-to-understand colour code (based on a “traffic light” approach), this initiative aims to provide citizens with more accurate information on the nutritional quality of food, although this measure has not yet been applied. In early 2019, the Ministry also signed an agreement with almost four hundred food companies that committed to reducing the content of saturated fatty acids, salt and added sugars in their products. However, the effects so far seem modest. In fact, the obesity rate has increased among adults, which may hinder progress in reducing cardiovascular mortality and other related causes of death: one in six Spaniards suffered from obesity in 2017 (17%), a increase compared to the figure of one in eight in 2001, also above the EU average (15%). This increase is related to poor physical activity among adults, as well as unhealthy nutritional habits: only about 35% of adults reported eating at least one vegetable a day. The same situation is found in the child-youth population. According to the PASOS study (2019), 14.2% of the child-youth population is overweight and obese as measured by BMI and 24.5% have abdominal obesity. The prevalence of childhood obesity has grown in the last two decades: 1.6% according to BMI and 8.3% according to abdominal obesity.
We cannot ignore the data. A healthy and active lifestyle contributes to our quality of life expectancy. Some basic recommendations:
Move, live an active life: go up the stairs, go to work on foot or by bike whenever possible, choose games that involve movement to do with your children, dance, etc.
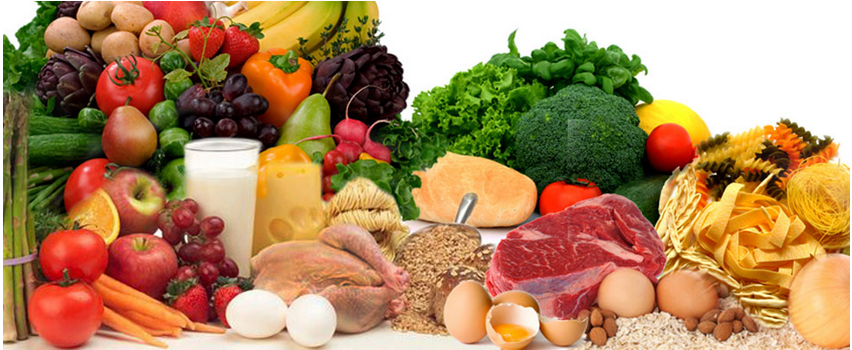
Eat calmly: follow your feeling of satiety and not your emotions (avoid eating due to boredom, anxiety, etc.). Limit ultra-processed food (you can read further in the post: Realfood, fad or is it here to stay?). Include fruits and vegetables in all your intakes. Give priority to whole carbohydrates over refined ones. Vary the food every day. Eat quietly and if possible, in company.
Hydrate yourself regularly throughout the day.
Exercise daily: dedicate at least 30 minutes a day to the physical activity that you like the most and vary it.
Rest and sleep between 6 and 8 hours a day.
Spend time on activities you like: reading, walking, writing, dancing, painting, photography, movies, meditating, talking to someone who inspires you, etc.
Maintaining healthy lifestyle habits should be an ever-present motto in our lives, but it becomes essential in difficult situations like the one we are experiencing. It is at these times when initiatives like #AlimentActivos from FIAB (Federation of Food and Beverage Industries) take on special relevance. It is a website where they give us tricks and ideas, pose challenges for us and provide us with scientific data and information to lead a healthy and active lifestyle.
Do not forget that, through social networks, you can follow a multitude of profiles that inspire us in matters of healthy eating and cooking, physical exercise at home, how to maintain good mental health, as well as stay positive and relaxed.
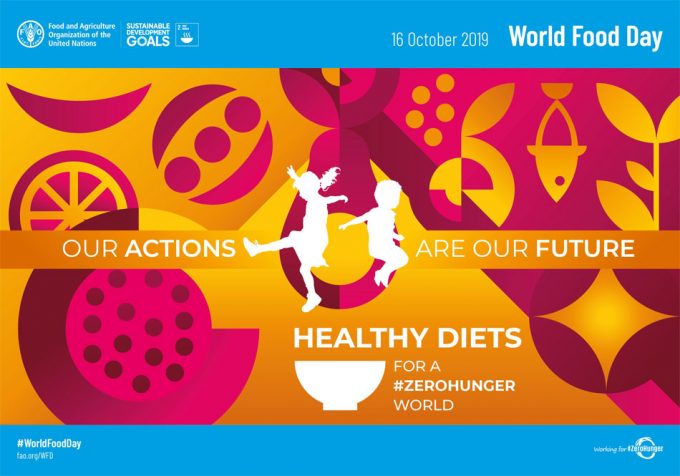
#ZeroHunger is the motto for the World Food Day that is celebrated on October 16 leaded by the Food and Agriculture Organization of the United Nations (FAO) worldwide. #ZeroHunger is also part of the Sustainable Development Goals (SDG) of the World Health Organization (WHO).
Achieving #ZeroHunger is not only about feeding hungry people, but also about doing it in a healthy and sustainable way. Food safety in our times is not only a matter of quantity, but also of quality. Unhealthy diets have become the first risk factor for disease and death worldwide and that is why we need to reach the entire population a sufficient variety of safe, nutritious and affordable foods, while caring for the health of the planet on which we all depend. World Food Day asks us to take action in all sectors to reach #ZeroHunger, 100% nutrition.
But what is a healthy and sustainable diet? FAO itself determines that a healthy diet is one that provides nutritional needs to maintain an active life and reduce the risk of contracting diseases through the consumption of safe, nutritious and diverse foods. And a sustainable diet supports entrenched solutions to food production with a low level of greenhouse gas emissions and a moderate use of natural resources such as soil and water, while increasing food diversity for the future.
What is the current situation?
The high consumption of dishes rich in sugars, refined starches, fats and salt have become the basis of food for developed countries, limiting the consumption of traditional dishes made with vegetables, legumes, whole grains, etc. We cook less, move less and consume more prepared dishes. The result is that we are malnourished. Do you find it alarming? Don’t you think it’s for so much? Let’s see some figures:
Currently, there are already more people with obesity and overweight in the world than those who are hungry: almost 800 million people (672 adults and 124 children) in the world suffer from obesity and another 40 million children are overweight. However, it is estimated that there are about 820 million people who suffer from hunger (approximately one in nine).
Unhealthy diets along with sedentary lifestyles have overcome smoking as the main risk factor for disability and death in the world.
Approximately 2 billion euros are spent each year to treat health problems related to obesity.
These are some of the conclusions reached by FAO related to hunger and malnutrition but they are not the only ones. Our way of feeding ourselves is also having environmental consequences:
The environmental damage caused by the food system could increase from 50 to 90%, due to the higher consumption of processed foods, meat and other products of animal origin in low and middle income countries.
Of some 6,000 species of plants grown for food throughout the history of mankind, today only three species (wheat, corn and rice) supply almost 50 percent of our daily calories. We need to consume a wide variety of nutritious foods.
Climate change threatens to reduce both the quality and quantity of crops, reducing crops. Rising temperatures are also exacerbating water scarcity, changing the relationship between pests, plants and pathogens, and reducing marine resources.
The current food system – which includes farming, animal husbandry, processing, packaging and transportation – is responsible for 37% of the total greenhouse gas (GHG)emissions generated annually, and losses and food waste also collaborates with 8-10% of the total sum. Belén Blanco tells us in more detail in the post “Tell me what you eat… and I’ll tell you if it’s good for the planet”.
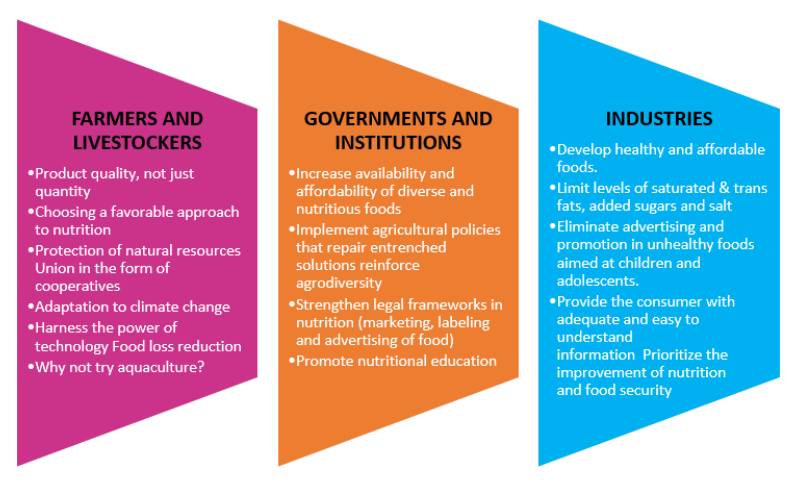
For all this, because they are realities, all together we must raise awareness of the problem of hunger, malnutrition, food waste, climate change, etc. FAO calls on all people to get involved in implementing some measure to achieve the #ZeroHunger.
Who are the actors involved in this change taking place? The answer is all. Modify the way of producing, supplying and consuming food. The involvement of the industry in limiting saturated and trans fats, added sugars and salt. Eliminate advertising and promotion in unhealthy foods and especially those aimed at children and adolescents. Implement educational programs on nutrition and health. Actions from all levels are necessary.
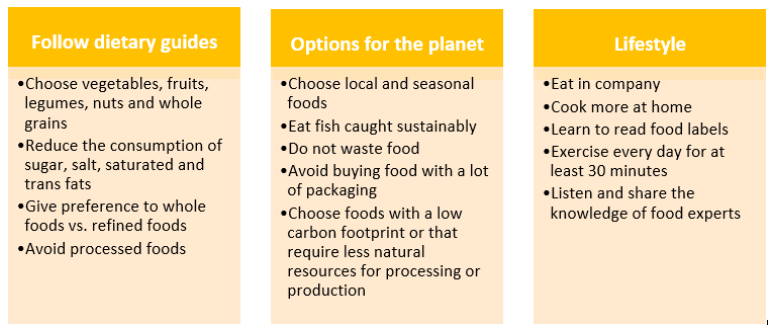
And I, as a consumer, what can I do? As a consumer, as a citizen, as a human being on this planet, you can. Think about how you consume, how you eat and act on your own, individual level and with the people around you. Here are a series of measures that can guide you:
World Food Day is not the only forum in which it strives to improve food security, but FAO also participates with WHO and other agencies in the implementation of the United Nations Decade of Nutrition Action (2016-2025). It aims to strengthen joint action to reduce hunger and improve nutrition worldwide and assist all countries in their specific commitments. The SOFI report is published annually to provide information on the progress made to eradicate hunger, achieve food security and improve nutrition. The last one was published on July 15, 2019.
On World Food Day, FAO launches a strong message: we can end hunger and all forms of malnutrition to become the #ZeroHunger generation. But this will entail the joint action of all, from the commitment of each one of us in the change in the way we feed ourselves, to the cooperation between countries for an efficient transfer of technology, for example, through the correct decision-making of governments or by the involvement of private companies and the media.
As you may already know, the increase in greenhouse gas emissions (mainly carbon dioxide and methane) as a consequence of human activity is one of the main reasons behind the faster pace of the climate change in the last decades. And among the wide range of causes, passenger cars are one of the main sources of CO2 emissions, accounting for a 12% of the total emissions (European Commission).
For this reason, the European Union has been adopting increasingly stricter measures to regulate the levels of emissions. In 2015, a limit of 130 grams CO2/km was set. Moreover, by 2021 a more ambitious target is planned to be fixed at 95 grams CO2/km.
In this context, car manufacturers have been forced to reduce fuel consumption (or increasing the autonomy in electric vehicles) and emissions in his petrol and diesel-fuelled models. How can automakers do that? Besides designing more efficient engines, the main strategy is lightweighting. This technique consists of reducing the weight of the car by replacing the heavier materials (i.e. steel) by lighter ones such as plastic or composites.
However, currently the mismanagement and misuse of plastics rather than the material itself is one of the top environmental issues, since 8 million tons out of the 300 million tons of plastic which are annually produced end up in the ocean (According to data from the International Union for Conservation of Nature). So seems that increasing the use of plastics in cars does not look like and ideal solution, right? Well, how about using an alternative material with similar of even better performance than conventional plastics and reduced environmental footprint? It doesn’t seem an easy task, although bioplastics may be part of the answer.
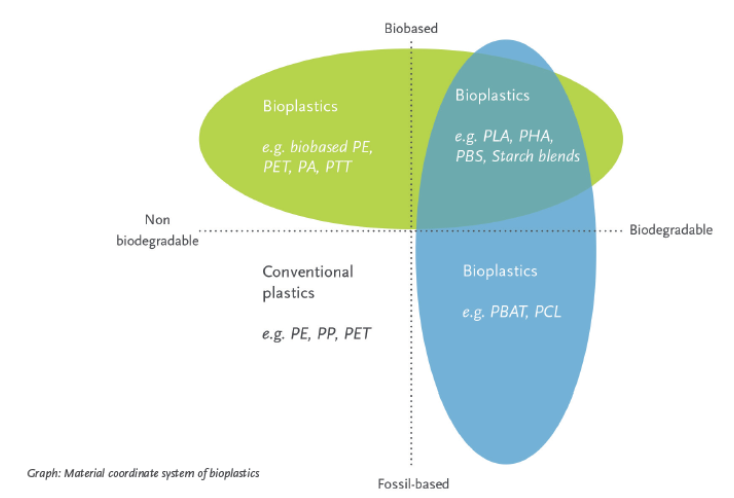
What are bioplastics, and why they seem to be so trendy nowadays? According to European Bioplastics, it’s a heterogeneous set of materials with different properties and applications which can be biobased, biodegradable or both.
In other words, since they are biobased, their use potentially reduce the consumption of fossil fuels while their biodegradability widens the possibilities of treatment at the end-of-life stage. As a result, these materials could achieve the desired combination of performance and sustainability.
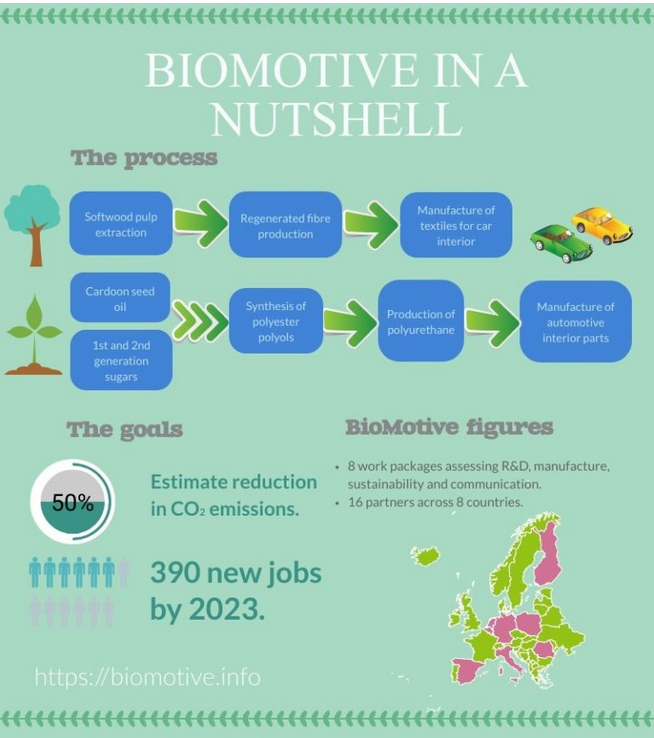
This is what the BIOMOTIVEproject is all about. It tries to develop materials (textile fibres, foams made of polyurethane for automotive seating and other polyurethane-based parts for the interior of cars) from biobased sources which combine good technical properties with reduced environmental impact. Starting from renewable raw materials such as forest biomass and vegetable oils not in competition with the food chain, it is expected to produce at industrial scale products with up to 80% biobased content.
The project has received funding under the European Union’s Horizon 2020 Research and Innovation Programme and gathers European private companies and institutions sharing the ideal of reducing the impact of the industry paving the way towards a more sustainable economy.
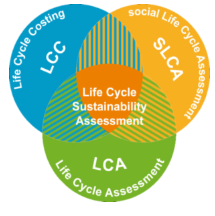
The role of CARTIFin the project is to perform the sustainability assessment of the final products, since the prefix “bio” does not necessarily mean that a product is better for the environment than its fossil-based counterpart. To determine that on a scientific basis, it is important to evaluate the impacts of the product along its whole life cycle (that is, from the extraction of raw materials to the end of life) considering not only the environmental impacts, but also social and economic aspects.
So the next time you are holding a plastic object, before throwing it away, it is worth considering from where it came and where will it go.
We are increasingly aware of the food that we eat, the nutrition intake that food brings and the impact of our shopping and consumption habits have on the planet. That is as it should be.
The food we consume, that is, ourdietary habits, contributes in one degree or another, to our health, but also, to the planet health by leaving a climatic footprint. Specifically, food production contributes to the effect on global warming through cultivation system, how animals have been raised, how they have been stored, processed, packaged and transported to the different markets around the world.
The current world food production system is affecting the terrestrial and marine ecosystems in a significantly way, thus contributing to the obvious climate change. It is not about being an alarmist, but is about becoming aware of a reality that is already happening.
On 8 august, the new report of the United Nations Intergovernmental Panel on Climate Change (IPCC, 107 experts from 52 countries) on “Climate Change and Earth”. The figures speak in this report and show that the current food system – which includes farming, animal husbandry, processing, packaging and transport – is responsible for the 37 % of the total greenhouse gas emissions (GHG) that are generated annually and that, food losses and food waste also collaborates with 8-10 % of the total.
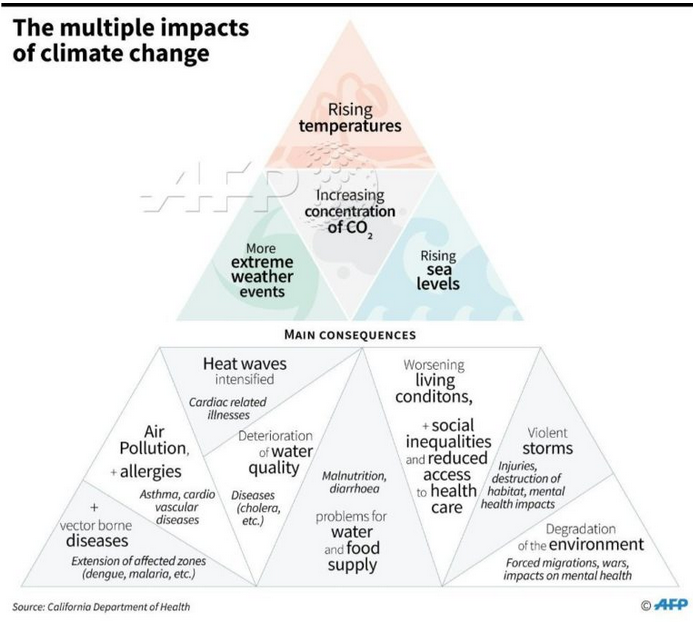
The consequences of these emissions are directly related to the increase of the CO2 level in the atmosphere, the increase in the temperature of the planet, the climatic disasters or the rise in the sea level, which turn into a clear threat to the quality and quantity of current crops. Therefore, affecting food security for the population, for the inhabitants of the planet, for all of us.
It is necessary to address the risks that are already present and reduce vulnerabilities in food production and distribution systems and land management.
According to the data from the IPCC report, climate change will affect food security by limiting access to certain foods, reducing nutritional quality and increasing their prices. The effects will be much more marked in low-income countries.
The Report stated that is necessary limiting global warming to 1.5 oC instead of 2 oC … And yes, this difference of half a degree is crucial on the effects on the soil, marine species and ecosystems and, also about the benefits that this would bring in nature for all humans; fishery, water supply and food insurance, in addition to health, safety and economic growth.
To limit warming, a reduction in CO2 and other GHG emissions is required by 45 % by 2030 (compared to the levels of 2010) and achieve net zero emissions by 2050. This requires a profound change and a rapid action in reducing these emissions in all sectors (energy, land, cities, transport, buildings, industry) so is necessary a greater investment in the application of new strategies and technology breakthrough.
With the focus on these actions aimed at adapting and mitigating the effect of climate change, the report indicates as better opportunities; an urgent change in human diet to achieve a reduction in GHG emissions linked to food production, an improvement in livestock and farming production systems to reduce the energy and water consumption currently used and, a reduction, to get eliminate, losses and food waste.
A healthy and sustainable diet includes foods with a lower carbon footprint so that, such diet, would be based on the consumption of vegetables, legumes, cereals, nuts and seeds as essential foods and foods of animal origin produced in resilient, sustainable and low GHG emission systems.
The report expressly states that, currently, livestock systems for meat and meat products production demand more water and soil and generate higher emissions of gases compared to those of cereal and seed production. This effect is greater in developed countries where breeding is carried out intensively and is urged to produce them in a sustainable manner.
In the study carried out by Poore & Nemecek (2018) it was also evidenced that the environmental impact of the production of food of animal origin exceeds that of plant production, highlighting the need to reformulate the practices carried out in this activity . They also showed that, although producers are a vital part of the solution to this problem, their ability to reduce environmental impact is limited. These limits mean that the same product can have a greater impact than another nutritionally equivalent and therefore, they also urge a change in the pattern of the diet.
The need to adapt our diet to the limits of sustainability aspects is evident and, so much so, that the IPCC refers to it as “low-GHG carbon diet”.
Low-greenhouse gases emission diets are balanced diets that require less water and less land use and cause less GHG. These are diets with more foods based on coarse grains, legumes, fruits, vegetables nuts and seeds and foods of animal origin produced in a sustainable way.
Other actions aimed at diversifying the food systems proposed in the report in relation to the form of food generation are; the implementation of integrated production systems, the improvement of broad-genetic resources, more intelligent and integrated agricultural systems, best livestock production practices and the reduction of fertilizers use. All of them, in order to reduce the environmental impact through better soil management as a strategy to achieve sustainable use and, therefore, quality food production.
Regarding the reduction of food waste, it is aimed at curbing the need to produce more and, therefore, to reduce the overexploitation of the soil and the consumption of water and nitrogen-based fertilizers, deforestation of areas to convert them into agricultural land and, in the cycle in which we are currently, worse crops are getting worse, poorer in nutrients and the consequent and foreseeable increase in the cost of cereals.
There is no one ideal solution, but a sum of many different actions.
We need to rethink our current food system and find new solutions to feed ourselves on a planet that continues growing. We are facing the challenge of finding effective solutions to produce food in a sustainable way. The way we produce food matters, in other words how we select what we are going to eat matters since it can face climate change and with the reduction in the pressure we are exerting on the land.
What we eat has a story to tell us … and that story makes us responsible and complicit in those effects. It is important to take a step forward in our diet and start thinking about what we eat beyond the hedonic aspect, since our consumption actions affect the productive capacity of the soil and, therefore, the quality of what is produced and even to the nutritional value of food. On the other hand, raising awareness of a more sustainable diet, in addition to collaborating in mitigating the effects of climate change, probably offers significant positive benefits on human health in the medium term.
In the arduous path towards sustainable development, research to obtain alternative fuels to fossils is presented as a key point. In this framework, two interesting actors have emerged to stay: biogas and biomethane.
Before going into the subject, let’s dig a bit into the current national gas system. Natural gas is one of the fuels most used by society, both in industry and in homes. Chemically, it is a gas composed mainly of methane 95-99% (CH4) and small proportions of other compounds. From its treatment, management and consumption in Spain, we must know two important aspects:
Almost all the natural gas we consume in Spain comesfrom non-renewable sources.
All this gas is mainly imported from countries such as Algeria, Norway, Nigeria or Qatar, either through the network of gas pipelines or through the transport of liquefied natural gas in large gas tankers.
While it is true that in comparison with other fuels the use of natural gas is better seen as it reduces emissions of CO2, particles and NOx, it isstill a fossil fuel. World natural gas reserves are estimated on 193 trillion m3, enough to cover demand for 52 years.
Biogas and biomethane are considered an interesting sustainable alternative in the fuel supply chain. Biogas is the fuel gas resulting from the degradation of organic compounds through a biological process. Depending on the precursors used, the volume composition of biogas ranges between 50% and 70% methane and 50% and 30% CO2. Biogas is an ideal fuel to generate heat or electricity, but, due to its low concentration of methane, it can not be used in its original form as a fuel for transportation nor can it be injected into the natural gas network. However, it can be ‘upgraded’ to be suitable for these last two applications. This improved biogas is known as biomethane. The CH4 / CO2 ratio of biomethane ranges between 95/5 and 99/1, a composition very similar to natural gas.
The key to make biogas and biomethane sustainable gases is to use as waste raw material that can not be reused or recycled. Not only do we talk about the typical urban waste that goes to the landfill, but also agricultural, livestock or wastewater are of high interest. These residues, when degraded, spontaneously emit methane into the atmosphere, whose impact on greenhouse emissions (GHG) is 21 times higher than CO2. In this way, this methane is generated in a controlled manner and after combustion is transformed into CO2, thus reducing the impact of GHG emissions.
The potential that Spain has to develop biomethane is very wide. Agriculture and livestock, one of the main engines of the national economy, generate an extensive amount of waste that contains very good “methanisable” characteristics. Likewise, every year each Spaniard generates half a tonne of direct waste, which is around 22,000 tonnes/year. The fact of being able to convert this waste into a fuel makes it possible to reduce greenhouse effect emissions at the same time as covering part of the imported natural gas consumption. The advantages are not only environmental; this new model allows the creation of new green jobs.
For the generation of biomethane there are multiple technologies, the anaerobic digestion followed by an upgrading is one of the best known and exploited. Anaerobic digestion consists on introducing a residue in a digester in absence of oxygen. In this digester the waste comes into contact with a biological culture (yes, bacteria) that are responsible for breaking down (hydrolysis) the long carbon chains, typical of organic matter, into smaller chains. After a few days, these bacteria continue to degrade the most simple carbon chains into methane. The product of this process is a mixture of gases, known as biogas, mainly composed of 60% methane, 40% CO2 and a minimum concentration of impurities such as hydrogen sulphide. In the process is generated a liquid waste called digestate that can be reused as a fertilizer because it is rich in nitrogen and phosphorus.
Once the anaerobic digestion is finished it is necessary to improve the quality of the biogas so that it can be used as fuel for vehicles or injected into the natural gas grid, this process is known as upgrading. After upgrading, the biomethane has a concentration close to 99%. There are different technologies that allow this process to be carried out:
Amine Absorption: Amines have high selectivity to attract CO2. The process is about “showering” the biogas with a dissolution of amines, which will sweep away the CO2, leaving the methane almost pure. The major disadvantage of this process is that the amines are not environmentally favourable.
Pressure swing adsorption (PSA): At high pressures, gases tend to be attracted to solid surfaces, or “adsorbed”. The higher the pressure, the more gas is adsorbed. Once the pressure is reduced the gas is released or un-adsorbed. This process requires a very high initial investment.
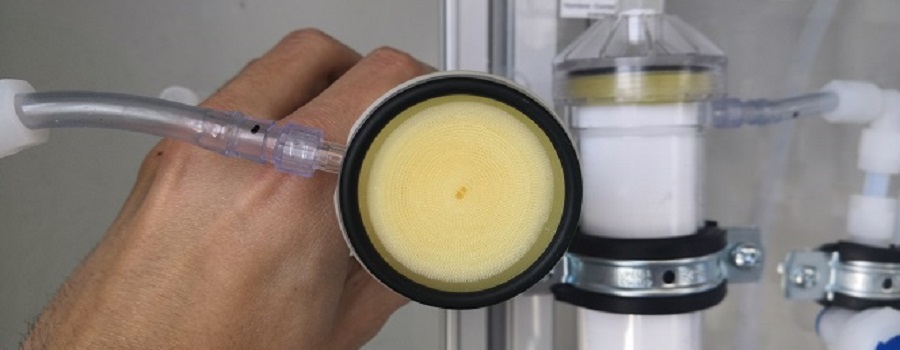
Membranes: This is a physical separation, as the biogas stream is passed through a porous membrane. The CO2 passes through the pores, while the methane remains. In order to obtain good separation yields, it is necessary to apply high pressures, making the process more expensive. In addition, methane slip is usually around 20% through the membrane pores, especially as they deteriorate.
Membrane contactor: These are the newest of those exposed. This technology agglutinates numerous membranes in the same shell, allowing the gas to pass through the inside of the membranes and a liquid flow through the casing. This combines physical and chemical separation. In this way, it is possible to work at lower pressures than in traditional membranes, as the water is able to dissolve part of the CO2, as well as reducing methane slip.
Once purified the biomethane would be almost ready for final use, or injection into the network. The last necessary process would be to compress it until the normal working pressure, for example, the natural gas grid is at a pressure of between 16-60 bars, or if it is desired to use as fuel a pressure of approximately 200 bars is required.
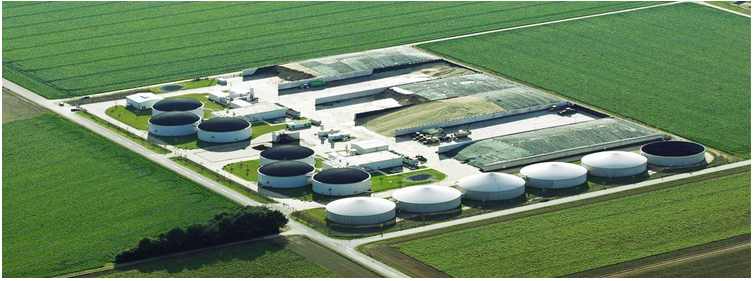
In some European countries such as Germany or Italy there are already industrial facilities that allow the production of biomethane, however, in Spain the biomethane market is still to be exploited. Aware of the potential that we have to develop the technology, policies are needed to make this market open gradually and be able to produce our own biomethane. This would reduce gas imports, the amount of waste produced and greenhouse gas emissions (and their corresponding EU fines) at the same time as creating jobs.