
The challenge of the characterisation of the building stock
It is well know that more than a third of the total final energy consumed in the European Union is consumed in residential and tertiary sector buildings. For this reason, in recent years, various directives and calls for proposals have tried to promote the renovation of buildings under energy efficiency criteria.
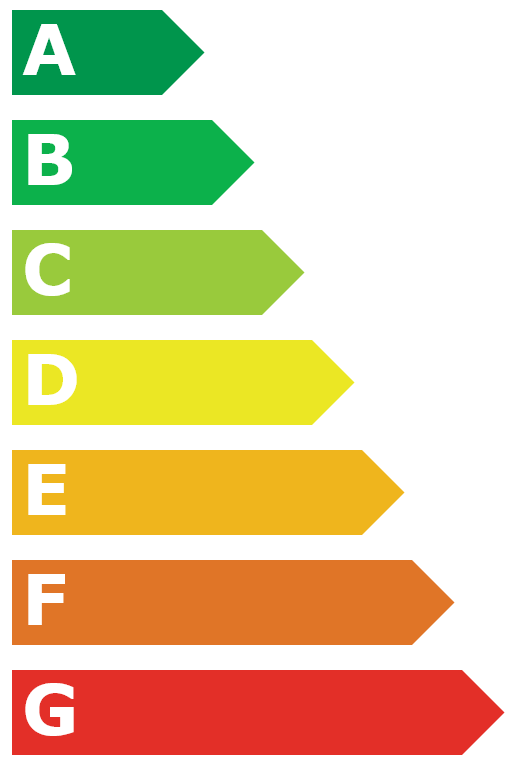
One of the directives in this field is the EPBD (2018/844 Energy Performance of Buildings Directive). This standard is the main European directive aimed at helping to reduce energy consumption and increase energy efficiency in buildings. This directive introduces the energy certificate as an official document that includes objective information about the energy characteristics of a property or building (you can learn more about energy certificates in our post ” Are energy performance certificates really useful?”). The information provided by these certificates (mainly energy demand and consumption, as well as associated CO2 emissions) is a valuable source of information to know the state of the buildings and thus be able to propose appropriate measures for the improvement of these buildings. Certification tools validated by a certification body are used to generate these certificates. You can check the tools validated in the case of Spain and technical documents that have been recognised by the Ministry for Ecological Transition and the Demographic Challenge and by the Ministry of Development in Spain and that can be used to support the building energy certification process. In these tools, the building information is introduced and the certification values are automatically calculated.
In addition to the validated energy certification tools on the market, there are many tools for modelling and simulating the behaviour of buildings. This is the starting point for the design of building renovation projects, since before the selection of the measures that could improve their consumption and emission parameters, a quantitative assessment of the building stock as realistically as possible is necessary. However, most of the tools available on the market works on a small scale (building,house,premises,etc.) and the generation and simulation of models for grouos of buildings (districts or cities) is a huge task. Undoubtedly, the problem of scale is one of the weak points of current tools when analysing districts or cities.
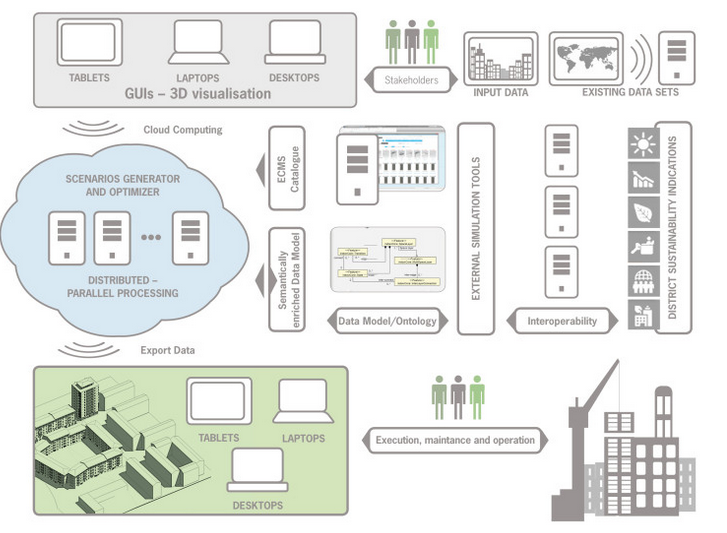
In CARTIF, for years, we have been working on the automatic generation of models to be able to characterise as automatically as possible the buildings of a certain location (district, municipality and even region) by calculating demand and consumption values using public information sources (cadastre and catalogue of constructive elements mainly) and different calculation engines. In addition, it has been proven that one of the fundamental aspects is certainly the addequate presentation of the results in an attractive, interactive visualisation that is able to provide all relevant information.
As a result of several projects in this line, CARTIF has designed and developed the visualisation tool GIS4ENER that offers the visualisation of several approaches:
(1) The estimation of demand calculation based on the automation of the CE3X certification tool for the calculation of large-scale buildings (neighbourhood or city)
(2) The generation of estimated values of demand, consumption and CO2 emissions through the application of automatically generated typologies with the study of the results reflected in real Energy Performance Certificates (EPCs). It also allows the results of both approaches to be compared with these EPCs.
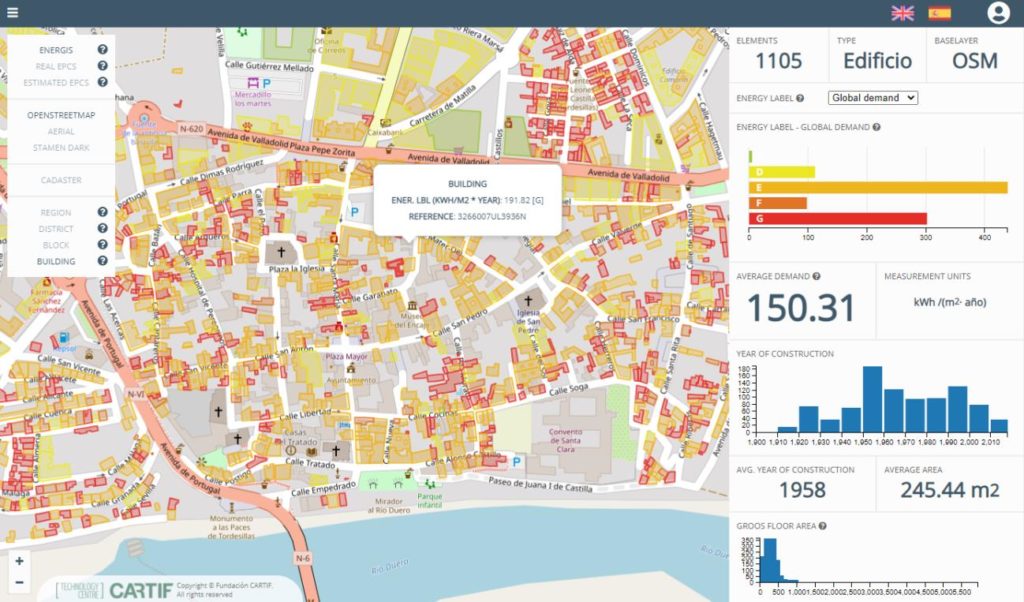
You can access to a demo of the GIS4ENER tool. In this demo the functionalities of the tool are presented with results obtained for the municipality of Tordesillas in the province of Valladolid (Spain).
At the moment the tool has been tested in several municipalities but it has the potential to be applied in any municipality in Spain, except those located in Navarra and the Basque Country.
There are many user groups that could benefit directly from this tool. Among them: regulatory bodies; public administrations; consultancies and energy companies; engineers, architects and urban planners; and construction companies. Our tool would allow to obtain a mapping of energy demand and consumption (as well as CO2 emissions) associated with buildings in a district or region, in much shorter time compared to obtaining the same with conventional methods. Undoubtedly the simplification of this step could bring a great benfit to al these users in their energy planning processes at various scales, development of strategic and business plans in certain districts or cities.
From CARTIF, we will continue to work on the research and development of tools that can continue to help reduce the impact of human beings on the environment.